
Search conditions, treatments, research reviews and articles. Press Enter to see all results, Esc to close.
Search conditions, treatments, research reviews and articles. Press Enter to see all results, Esc to close.
Blog
October 31, 2026
A glaucoma visual field test report shows how well each tested spot in your vision saw small lights, compared with healthy people your age. Read it in order: check that the test was reliable, then look at the probability maps, then the summary numbers. These are MD (overall loss), PSD (how patchy the loss is), VFI (a percentage score) and the Glaucoma Hemifield Test [1].
One test rarely settles anything. Learning, fatigue and cataract can all shift results, so eye doctors look for patterns that repeat across several tests [2,3]. This guide covers reading the printout. For what to expect from each glaucoma test, see our guide to glaucoma tests: eye pressure, OCT and visual fields.
This article is general education. It cannot diagnose glaucoma or tell you whether your own test shows progression. Bring your report to your eye doctor, and do not change your drops based on a printout.
Key takeaways
In this article
A visual field test tracks slow change, not sudden symptoms. A curtain or shadow over your vision, a burst of new floaters, flashes, sudden vision loss or severe eye pain needs care right away. Do not wait for your next scheduled test [9,10].
Call 911 for: sudden trouble seeing, especially with face drooping, arm or leg weakness, trouble speaking, confusion, or sudden dizziness. Any one of these can be a sign of a stroke [11].
Go to an eye doctor or emergency room right away for:
See our guide to eye emergencies for other warning signs.
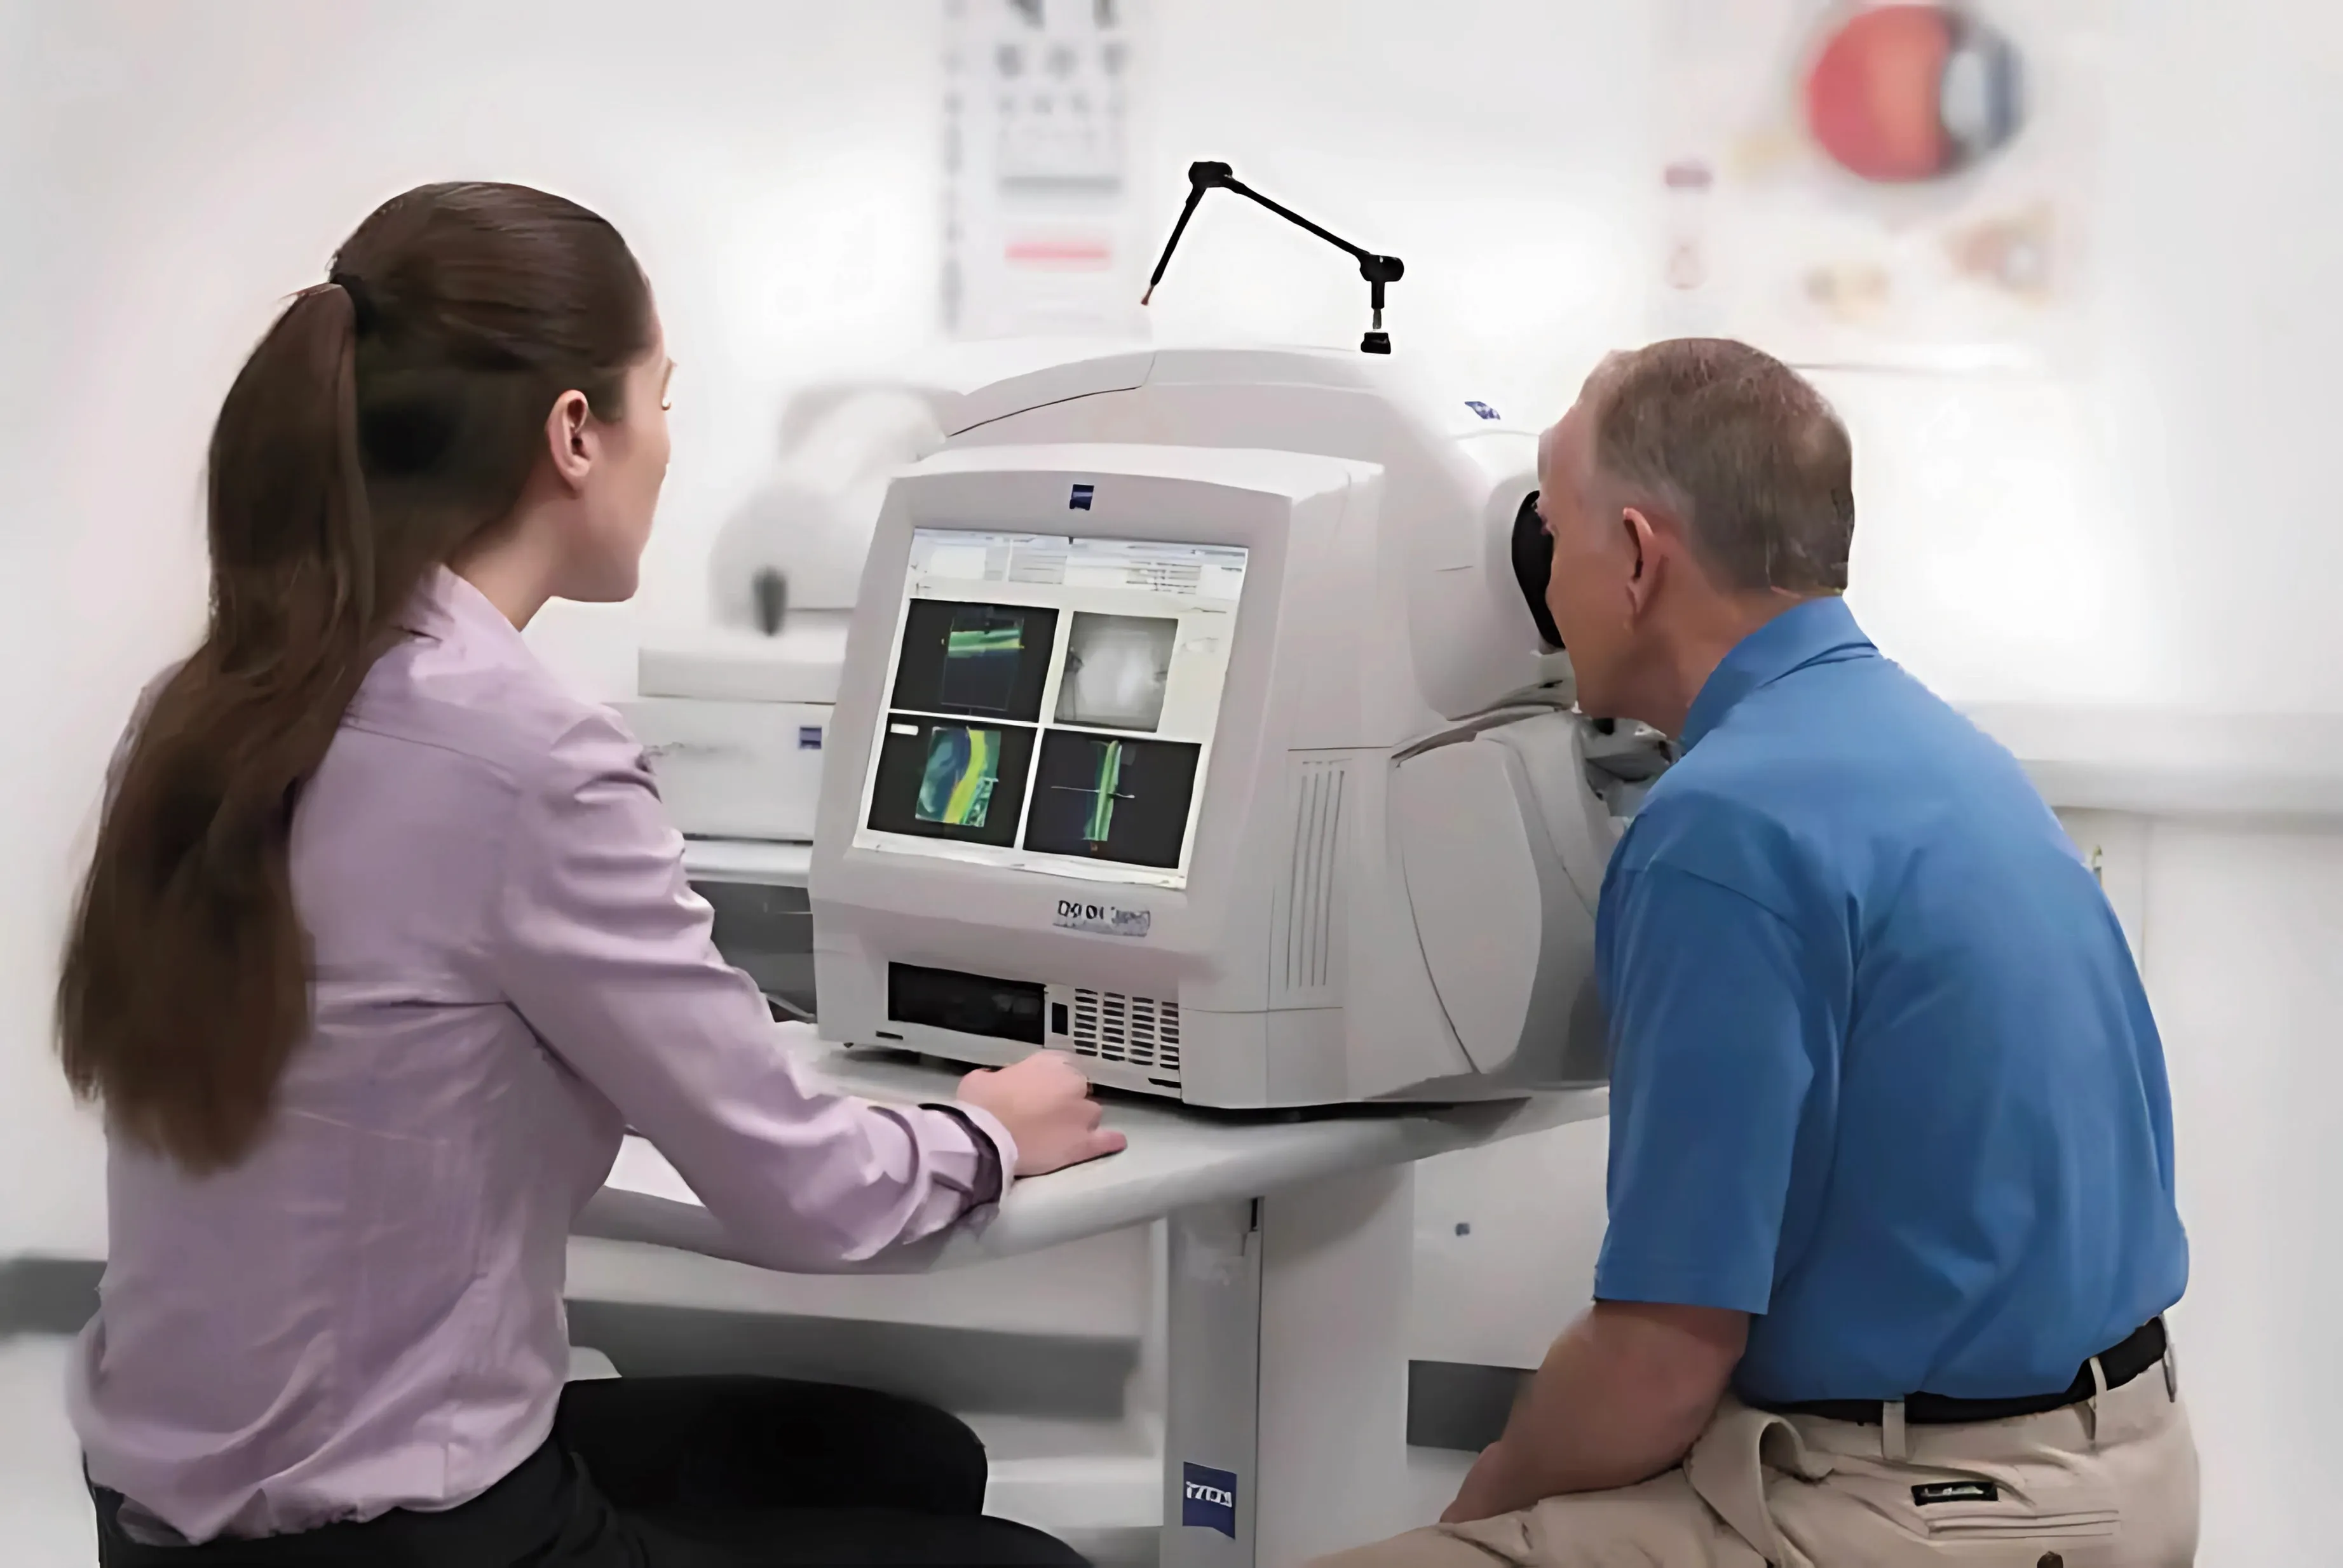
A visual field test, also called perimetry, maps how sensitive each part of your side and central vision is to light. You look at a central target and press a button when you see a small flash. Each eye is tested on its own, and the results are compared with healthy people your age [1,12].
Most glaucoma clinics use the Humphrey Field Analyzer [1]. Some flashes are too dim to see on purpose. About half the lights in a typical test are not expected to be seen, so missing many is normal [2]. With both eyes open, one eye can cover a blind spot in the other, so real loss can go unnoticed in daily life [12].
Most Humphrey reports share one layout. Read from top to bottom: test details, reliability, gray scale, deviation maps, Glaucoma Hemifield Test and global indices. The probability maps carry the most weight. The gray scale is the least reliable part [1].
These names describe which spots are tested. The 24-2 pattern spaces points 6 degrees apart across the central field. The 10-2 packs 68 points, 2 degrees apart, into the central 10 degrees. The 24-2C adds 10 central points to the 24-2. Denser central testing can find small central defects that the 24-2 misses [13,14].
The 24-2 has only 12 points inside the central 10 degrees [13]. In a study of 775 eyes, the 10-2 found central defects in 40% of glaucoma-suspect eyes that looked normal on the 24-2 [14]. The 24-2C can flag a central cluster of loss, and the 10-2 maps it in more detail [15]. Switching patterns makes results harder to compare [2].
Check the three reliability indices. Fixation losses track how often your eye drifted from the center. False positives count presses when no light appeared. False negatives count missed lights that should have been bright enough to see. Common rules accept fixation losses and false negatives under 33% and false positives under 15% [1].
The gray scale shades your raw sensitivity, with darker areas meaning lower sensitivity. It is easy to look at but the least reliable part. The total and pattern deviation probability maps matter more, because they show which spots are unusual for your age [1].
The gray scale groups values in 5 dB steps, and older or cataract eyes look darker without glaucoma [1]. Experts advise against decisions based on gray-scale plots [2]. On the probability maps, darker symbols mark stricter levels, such as fewer than 5%, 2%, 1% or 0.5% of healthy eyes [17]. Doctors look for clusters of flagged points in an arc above or below center, matching the nerve fiber layout [12].
Total deviation shows all loss, including dimming from cataract or small pupils. Pattern deviation removes that general dimming. Loss on the total map but not the pattern map often points to cataract [1,12,17].
Mean deviation (MD) is the average difference, in decibels, between your sensitivity and that of healthy people your age. An MD near 0 dB is normal. The more negative the MD, the more overall loss. Cataract and other clouding of the eye also lower MD [1,12].
The widely used Hodapp-Parrish-Anderson system stages glaucoma partly by MD [17]:
The full system also counts flagged points and checks the central 5 degrees [17]. In 158 eyes from a large trial, average MD improved from -13.2 to -11.9 dB after cataract surgery, while the deepest blind areas did not change [5]. That gain reflects clearer optics, not nerve repair. For tracking change, MD detected worsening sooner than VFI or PSD in one study [18].
Pattern standard deviation (PSD) measures how uneven your field is. A normal field is smooth, so PSD is low. Glaucoma usually causes patchy loss, which raises PSD. A PSD flagged at P < 5% on two tests in a row meets one set of minimum criteria for glaucoma damage [1,17].
PSD does not simply climb as glaucoma worsens. In very advanced disease, loss can become so widespread that the pattern deviation map looks almost normal. PSD can then level off or fall while vision is worse [1]. Read PSD with MD, VFI and the maps.
The visual field index (VFI) is an age-adjusted percentage score of the visual field. A VFI of 100% means a normal field, and 0% means no measurable field. It gives more weight to central points and was designed to be less affected by cataract than MD [1,6].
VFI is not the share of your sight that remains. In one study, VFI looked more optimistic than eight experts' judgments in about half the eyes. Typical matches were MD -5 dB with VFI 91%, MD -10 dB with 76%, and MD -15 dB with 60%. VFI often stays at 100% in early damage, which can hide early change [7]. The VFI trend plot projects the current rate a few years ahead, assuming nothing changes [1].
The Glaucoma Hemifield Test (GHT) compares five zones in the upper half of your field with matching zones in the lower half. Glaucoma often harms one half more. Results read "Within normal limits," "Borderline" or "Outside normal limits," and sometimes "General reduction of sensitivity" or "Abnormally high sensitivity" [1,8].
A field defect must also match the optic nerve, because brain and retina problems can cause field loss too [12].
The "usual reassuring result" column is a general guide, not a pass mark for your own eye.
| Term | What it tells you | Usual reassuring result | Worth asking about |
|---|---|---|---|
| Fixation losses | How often the eye drifted off center | Under 33% | A high rate with an odd pattern [1,4] |
| False positives | Presses when no light appeared | Under 15% | Any high rate, which makes the field look better [1,4] |
| False negatives | Missed lights that should have been seen | Under 33% | A high rate in an early or normal field [1] |
| Mean deviation (MD) | Overall loss versus your age group, in dB | Near 0 dB | More negative values, or a drop over time [1] |
| Pattern standard deviation (PSD) | How patchy the field is | Low, without a P flag | A flagged value, or a fall in advanced loss [1] |
| Visual field index (VFI) | Age-adjusted field score, 0% to 100% | Close to 100% | A falling trend over several tests [6] |
| Glaucoma Hemifield Test | Upper versus lower half | Within normal limits | Borderline or outside normal limits [1] |
| Pattern deviation map | Local defects after removing general dimming | Few scattered flags | A cluster of flagged points in an arc [12] |
| Guided Progression Analysis | Change versus your baseline tests | No progression flag | "Possible" or "likely" progression [1] |
They compare a series of tests, not one. Event analysis asks whether points have dropped below your baseline by more than normal test-to-test wobble. Trend analysis plots MD or VFI over time to estimate a rate of change. Both need several reliable tests done the same way [1,2].
The Humphrey Guided Progression Analysis (GPA) uses your first two tests as a baseline. It flags "Possible progression" when at least three points worsen on two tests in a row. It flags "Likely progression" when the same points worsen on three tests in a row [1]. In a simulation of stable eyes, "possible progression" appeared falsely in 34% over five years, compared with 7% for "likely" [19]. "Possible" is a prompt to retest, not a verdict.
Experts recommend six field tests in the first two years after diagnosis, and more when risk is high [2]. Most people in routine care lose field slowly. In 2,324 glaucoma patients and suspects followed for about 7 years, the median MD change was -0.05 dB per year, with faster loss at older ages [20]. Our article on glaucoma as a nerve disease explains why loss can continue at normal pressure.
Here is an invented right-eye 24-2 report. Fixation losses 2 of 15, false positives 3%, false negatives 5%. MD -4.2 dB, PSD 5.1 dB (P < 0.5%), VFI 93%, and GHT "Outside normal limits." The pattern deviation map shows flagged points in an arc above center.
This reads as a reliable test with an early, localized defect. MD better than -6 dB fits the early stage, and the high PSD and GHT result fit patchy loss [1,17]. Next, the doctor checks whether the arc matches the optic nerve and OCT and repeats on another test. If a later test shows MD -5.0 dB, that 0.8 dB drop alone does not prove progression, because results vary between tests [2].
Keep copies of full reports if you change doctors. For how field loss affects vision rules, see our guide to legal blindness and visual field criteria.
Netra Restoration Therapy (NRT) is an integrative program used alongside, not instead of, care from your eye doctor. NRT cannot diagnose glaucoma or judge progression. It does not lower eye pressure, and it does not replace drops, laser or surgery. NRT has not been tested in controlled trials for glaucoma.
If you use any complementary care, judge field results by the same rules. Use the same machine and pattern, check reliability, allow for learning, and confirm changes on repeat tests [2,3]. Read about how NRT effectiveness should be evaluated.
A normal result usually has reliable indices, an MD near 0 dB, a PSD without a significance flag and a VFI close to 100%. The Glaucoma Hemifield Test reads "Within normal limits." A few scattered flagged points are common in healthy eyes.
Yes. Learning effects, fatigue, pressing too often, a drooping eyelid, a lens rim in the way or cataract can all change a result. That is why an abnormal test is usually repeated before conclusions are drawn.
Yes. Cataract dims light across the whole field, which lowers MD and can trigger "General reduction of sensitivity." The pattern deviation map and VFI are less affected. MD often improves after cataract surgery, but that reflects clearer optics, not repaired nerve tissue.
It depends on your risk and how stable your glaucoma is. Experts suggest six tests in the first two years after diagnosis to set a baseline and catch fast change. After that, stable patients are often tested less often, as their doctor advises.
On the Glaucoma Hemifield Test, "Borderline" means the upper and lower halves differ a little more than usual, but not enough to be outside normal limits. It is not a diagnosis. It usually means repeat testing and a close look at the optic nerve.
No. VFI is an age-adjusted score of the tested field in one eye, weighted toward the center. It does not measure both eyes together, reading ability or how much sight remains, and it can look more optimistic than experts' judgments.
No. Glaucoma damage to the optic nerve is permanent, so true field loss does not come back. A test can look better because of learning, cataract surgery or normal variation. Treatment aims to stop or slow further loss.
Sources checked October 31, 2026.
This article provides general education and does not replace an individual eye examination, diagnosis or treatment plan. Sudden vision loss, a new curtain or shadow, a burst of new floaters or flashes, or severe eye pain needs emergency care right away, not a routine field test.