Clinical guide
An independent, parameter-level interpretation guide to the Topcon CA-800 corneal analyzer: what each report family measures, how to read its numerical fields, which reference values can reasonably be applied, and where the instrument stops.
September 23, 2026
Reading the CA-800 Report is a parameter-level clinical companion to the Topcon CA-800 corneal analyzer. It takes each report family the instrument produces — the corneal map and its tabs, keratometry, the keratorefractive and keratoconus indices, height and elevation, comparison, Zernike and optical-quality displays, pupillometry, tear breakup, blink analysis, tear meniscus, meibography, fluorescein, the contact-lens and toric IOL modules — and answers the same four questions for every field: what does it measure, how is it sampled, which reference values can reasonably be applied, and what can the result not establish.
The guide was written for practising optometrists and ophthalmologists, with residents, fellows and ophthalmic technicians as secondary readers. It is meant to sit beside the instrument and be read at the slit lamp, not to replace the manufacturer’s user manual, which remains the authority on operation, calibration and servicing.
This guide is also available as a 70-page illustrated PDF, formatted for print and for reading on a tablet: Reading the CA-800 Report, Edition 3.1 (PDF, 70 pages, 5 MB). It contains 31 original figures: fourteen annotated schematic panels, one for each report family, and seventeen explanatory figures on maps, scales, elevation, Zernike terms, tear-breakup endpoints and meibography.
A CA-800 report describes the anterior corneal surface reconstructed from a Placido reflection, the tear film observed over that surface, the pupil under programmed lighting, the visible lid margin glands under infrared light, and the fluorescein pattern under blue light. It does not measure the posterior cornea, corneal thickness, intraocular pressure, corneal biomechanics or the retina.
Read a report in this order and it is difficult to go badly wrong:
Three rules that hold throughout the guide. A green index is a screening result and a red index is a reason to investigate; neither replaces a diagnosis. No universal numerical normal boundary has been verified for the CA-800 keratoconus, irregularity, asymmetry, aberration or 5% tear-breakup outputs; where this guide gives an orientation value it is population context, not an instrument threshold. And a cutoff published for another instrument is not a CA-800 cutoff — K >47 D, I-S >1.4 D, KISA% >100, Pentacam BAD-D ≥1.6 and the Belin/Ambrósio elevation-difference limits each belong to the device and dataset that produced them.
The sequence below is the interpretation order the rest of this guide expands. Each step names the report to look at, the question to answer, and the section where the detail sits.
| Step | Look at | Ask | Section |
|---|---|---|---|
| 1 | Patient header, eye, date, software version | Is this the right eye, the right visit, the intended baseline? | Acquisition and quality control |
| 2 | Raw Placido image; ring tracing; coverage | Are the rings sharp, continuous, correctly traced, with the region of interest covered? | Acquisition and quality control |
| 3 | Test order and lens history | Were non-invasive tear and shape measurements obtained before dye, drops or gland expression? How long since lens removal? | Acquisition and quality control |
| 4 | Axial map at absolute scale; then tangential | What is the overall pattern? Is any focal steepening reproducible on repeat capture? | Reading the corneal map |
| 5 | K tab: Kflat, Ksteep, cylinder, axis, zone diameters | Do the numbers agree with the map, the refraction and the slit lamp? | Keratometry and astigmatism |
| 6 | I tab and KC/AK tab: irregularity, asymmetry, KPI class | Is the anterior pattern regular? What does the software class say, and what does it not establish? | Keratorefractive indices; Keratoconus screening indices |
| 7 | HEIGHT report (if used) | Which reference surface and fit diameter? Is residual elevation being confused with posterior elevation or thickness? | Height and elevation reports |
| 8 | ZER report | At what aperture? Which terms are included in the RMS total? | Zernike coefficients; Optical quality displays |
| 9 | PUP report | Under which lighting protocol, and with what adaptation and medication context? | Pupillometry |
| 10 | TBT summary and raw movie | Which endpoint — first break or 5% level? Was the recording censored ("> duration")? | Tear breakup |
| 11 | Blink, OPI, TMH, MEIB, FLUO | Are the lid, meniscus and gland findings consistent with the breakup result and the symptoms? | Ocular surface sections |
| 12 | COMP / DIFF (if a prior exists) | Same eye, same scale, same zone, same reference? Does the change exceed repeatability? | Comparison and progression |
| 13 | Everything together | What pattern emerges, what else could explain it, and what examination comes next? | Worked examples; Practitioner workflow |
Clinical question. A practitioner holds a CA-800 printout or screen and needs to know what a field measures, whether the number can be trusted, what population or instrument context applies to it, and what the report cannot tell them.
Scope. This guide covers the report families and clinical fields documented for the reviewed CA-800 software. Hardware generation, regional licence, installed lens database and i-MAP version may expose different layouts or omit modules. Tear meniscus height acquisition is specified from hardware version HW2; toric IOL calculation is an optional module. No sample reports from any particular unit were supplied for this edition, and no CA-800 keratoconus index, software version or ring-count statement beyond those on the manufacturer's public product page has been independently confirmed.
Exclusions. The guide does not cover instrument operation, servicing, calibration mechanics beyond what a reader needs to judge report validity, or the clinical management of any condition discussed.
Every reference value in this guide belongs to one of three categories. The category determines how much weight the value can carry.
| Reference category | Meaning | How to apply it |
|---|---|---|
| Device-defined | A field or calculation documented in the CA-800 manual | Its name, unit and sampling zone should match the installed software. Confirm against the installed version before applying a threshold |
| Clinical reference | A typical value or a threshold supported by broader clinical evidence, often from a different population or instrument | Useful for orientation. It is not automatically a CA-800 reference interval and should be labelled with its source when recorded |
| No validated cutoff | No universal numerical normal/abnormal boundary established in the reviewed sources | Use quality, morphology, within-eye trends and the instrument's own classification. Do not invent a cutoff, and do not import one from another device |
Sources: [1] §§13–17; [2]; [20].
A printed report may contain only a selection of what is visible on screen. Save supplemental screens when they explain a decision, especially the KC/CLMI tabs, asphericity details and dynamic graphs.
| Report | What it contains | What it is used for |
|---|---|---|
| Corneal map | MAP; K, I, KC/AK and P tabs; OD/OS view | Shape, corneal astigmatism, irregularity and ectasia screening |
| Comparison map | COMP / DIFF; current and prior examination | Location and magnitude of change under matched settings |
| Contact lens | Lenses: Gallery, Ref, K/L, T/D, Profile | Geometric simulation and selection of trial lens parameters |
| Height map | HEIGHT; reference surface, fit diameter, profile, 3D | Anterior surface departure from a mathematical reference |
| Zernike analysis | ZER; maps, coefficients and optical simulations | Anterior corneal contribution to optical aberrations |
| Pupillometry | PUP; dynamic, photopic, mesopic, scotopic | Pupil diameter, position and response to illumination |
| Toric IOL | Optional lens calculation module | Planning calculation using measured K plus external inputs |
| Screenshot | Current display; also useful for WTW or extra graphs | Preserves settings and images omitted from standard reports |
| NIBUT / TBT | TBT Summary, single acquisition, maps, Blink | Tear stability and blink-related exposure |
| Meibomian gland | MEIB image and selected analysis area | Visible gland morphology and percentage area of loss |
| TMH | Tear meniscus image, calipers and profile statistics | Inferior tear reservoir height |
| Fluorescein | FLUO photographs or selected video frames | Ocular surface staining and observed contact lens fit |
The height, comparison and contact-lens reports are available from their corresponding environments. Select the eye, report type and export destination deliberately, and inspect the resulting PDF for legibility and the acquisition date. White-to-white and blink analysis are documented functions even where they are not separate print-menu entries.
The manufacturer's public specification describes the CA-800 as a 24-ring Placido system measuring 6,200 points and analysing more than 100,000, with coverage up to 9.8 mm on an 8.00 mm radius sphere, and lists corneal wavefront analysis, tear-film breakup, tear meniscus height and blink analysis, meibomian gland analysis, four-condition pupillometry, contact-lens fitting simulation and white-to-white measurement among its functions. The page states no software version and names no keratoconus screening index; any index statement in this guide is therefore sourced to the manual, not the product page.
Sources: [1] §§14–17; [2]; [20].
| Check | What it means and why it matters | Expected value / clinical interpretation |
|---|---|---|
| Identity and context | Confirm patient, OD/OS, time, software version, test purpose, lens wear and prior surgery | A correct measurement attached to the wrong eye or baseline is clinically misleading |
| Calibration | Follow the supplied calibration tool workflow. Rev. 18 calls for daily checks and checks after transport, impact or thermal shock | Use the software pass/fail result. Instrument resolution is not a threshold for clinically real change |
| Tear-sensitive test order | Obtain non-invasive tear and topographic data before dye, anaesthetic, Schirmer strips or gland expression | Document recent drops, blinking instructions, environment and time since contact-lens removal |
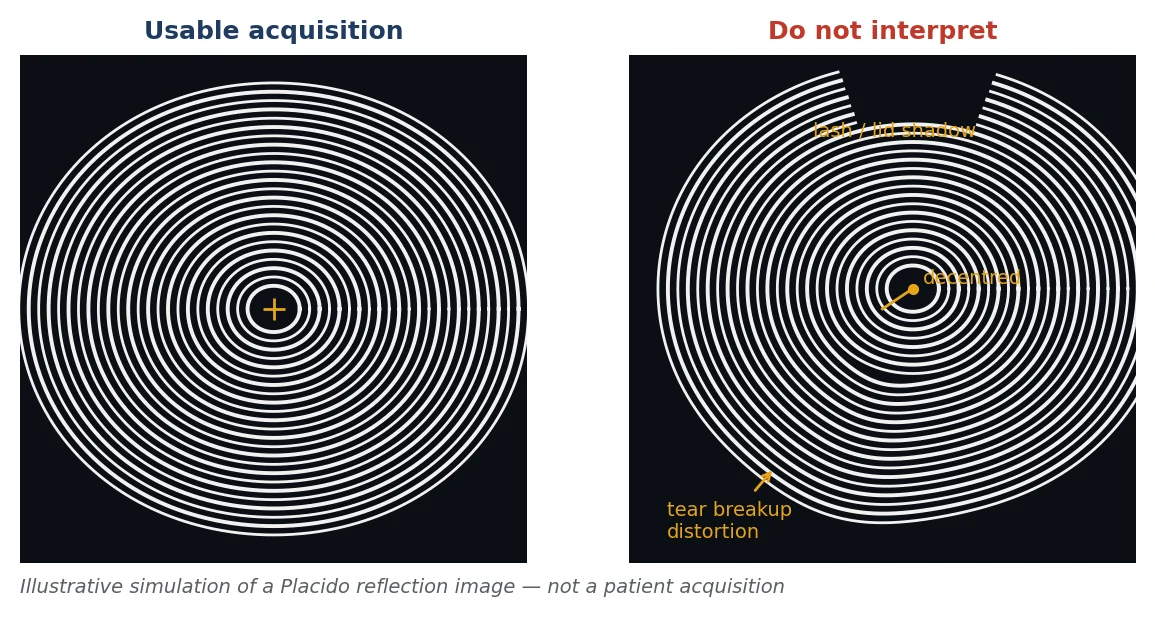
| Raw Placido image | Look for sharp, continuous, correctly traced rings with adequate coverage of the region being interpreted | Lashes, eyelid shadow, mucus, breakup and poor fixation can create apparent steepening or irregularity |
| Repeatability | Acquire repeat acceptable scans when findings matter to diagnosis, surgery or progression | Inspect agreement of shape and axis, not merely whether the device selected a "best" frame |
| Missing data | Check lids and ring coverage before interpreting peripheral maps or large-pupil simulations | Blank or excluded regions are not normal findings. Interpolated display points are not independent measurements |
| Manual editing | Record edited ring points, limbus boundaries, pupil outlines or meibography regions | Reacquire when feasible. Editing should correct visible segmentation error, not make a result appear normal |
There is no single washout interval suitable for every soft, rigid or orthokeratology lens. Record the lens design and removal time, and use a corneal specialist's stabilisation protocol for ectasia or surgical assessment. After orthokeratology, expected treatment-related flattening must be distinguished from the untreated baseline. In contact-lens wearers the CA-800 non-invasive breakup measurement and a subjective tearscope measurement are not interchangeable, and the published agreement work carries a subsequent correction; see the tear breakup section.
Usable scan: adequate focus + valid ring tracing + representative tear surface + appropriate coverage + reproducible result. A single impressive colour map cannot compensate for failure of these checks.
Sources: [1] §§13.2, 13.5–13.9, 14.1.10; [4]; [13–16].
Figure 2 · The MAP report and its tabs
What the corneal map report contains, and where each field discussed in this section and the next three sits.
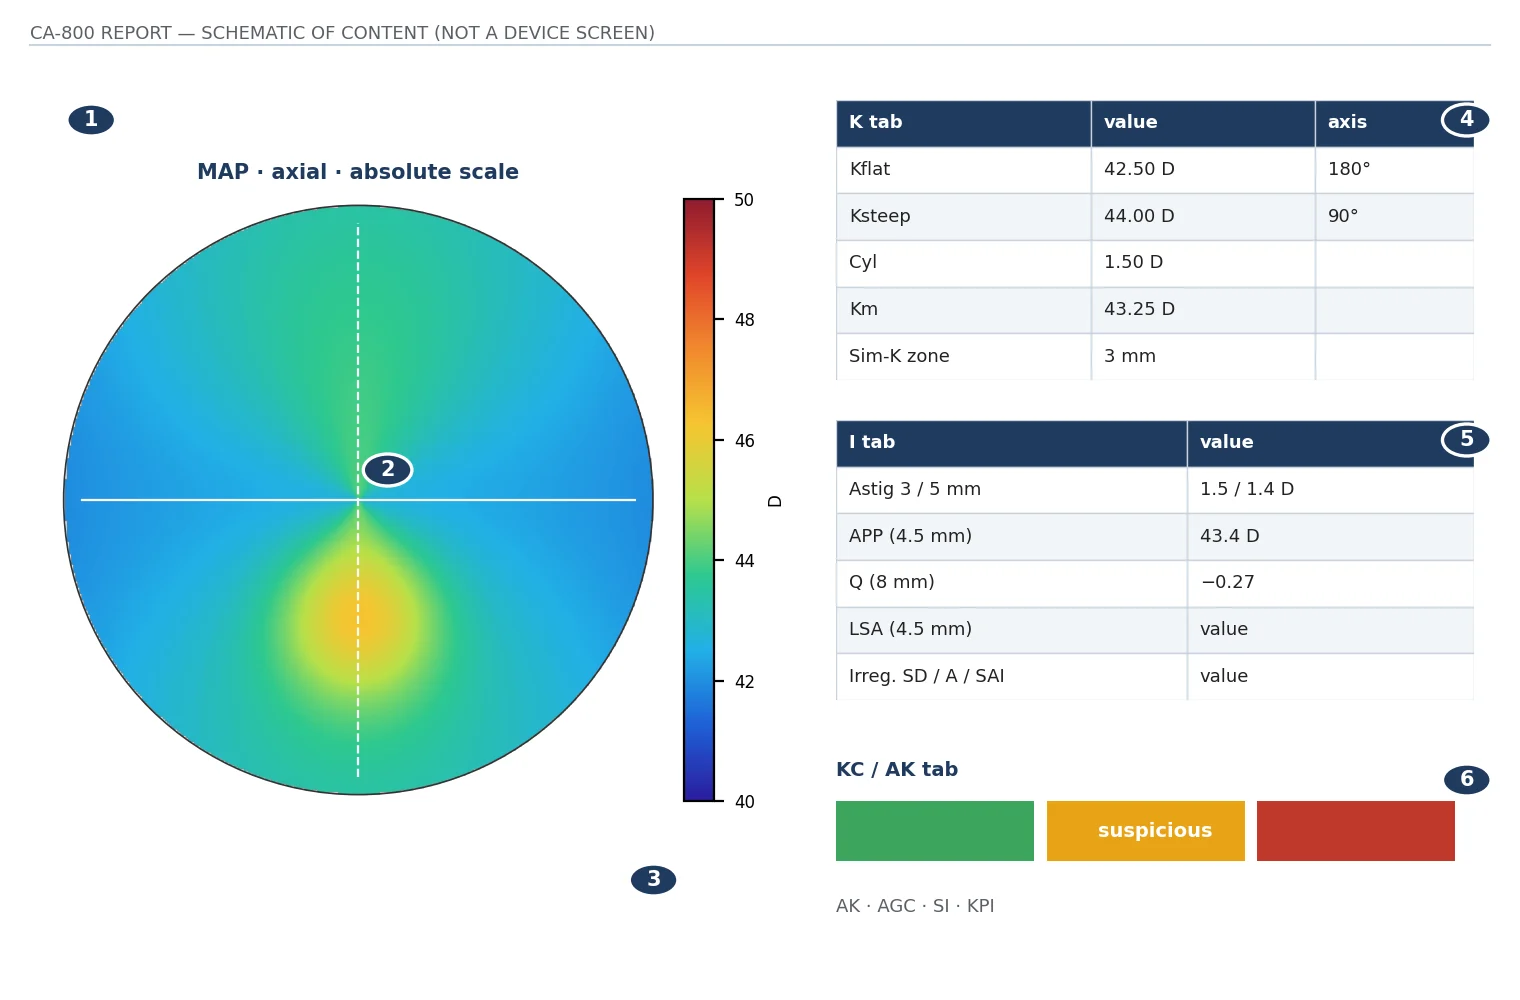
Schematic of the report’s documented content drawn from the manual’s field list; values are illustrative and the layout is not a reproduction of the device screen.
Placido topography reconstructs anterior surface shape from reflections on the tear-coated cornea. It does not directly image posterior corneal elevation or measure corneal thickness. A CA-800 height map remains an anterior-surface reconstruction.
| Parameter / unit | What it means and why it is used | Expected value / clinical interpretation |
|---|---|---|
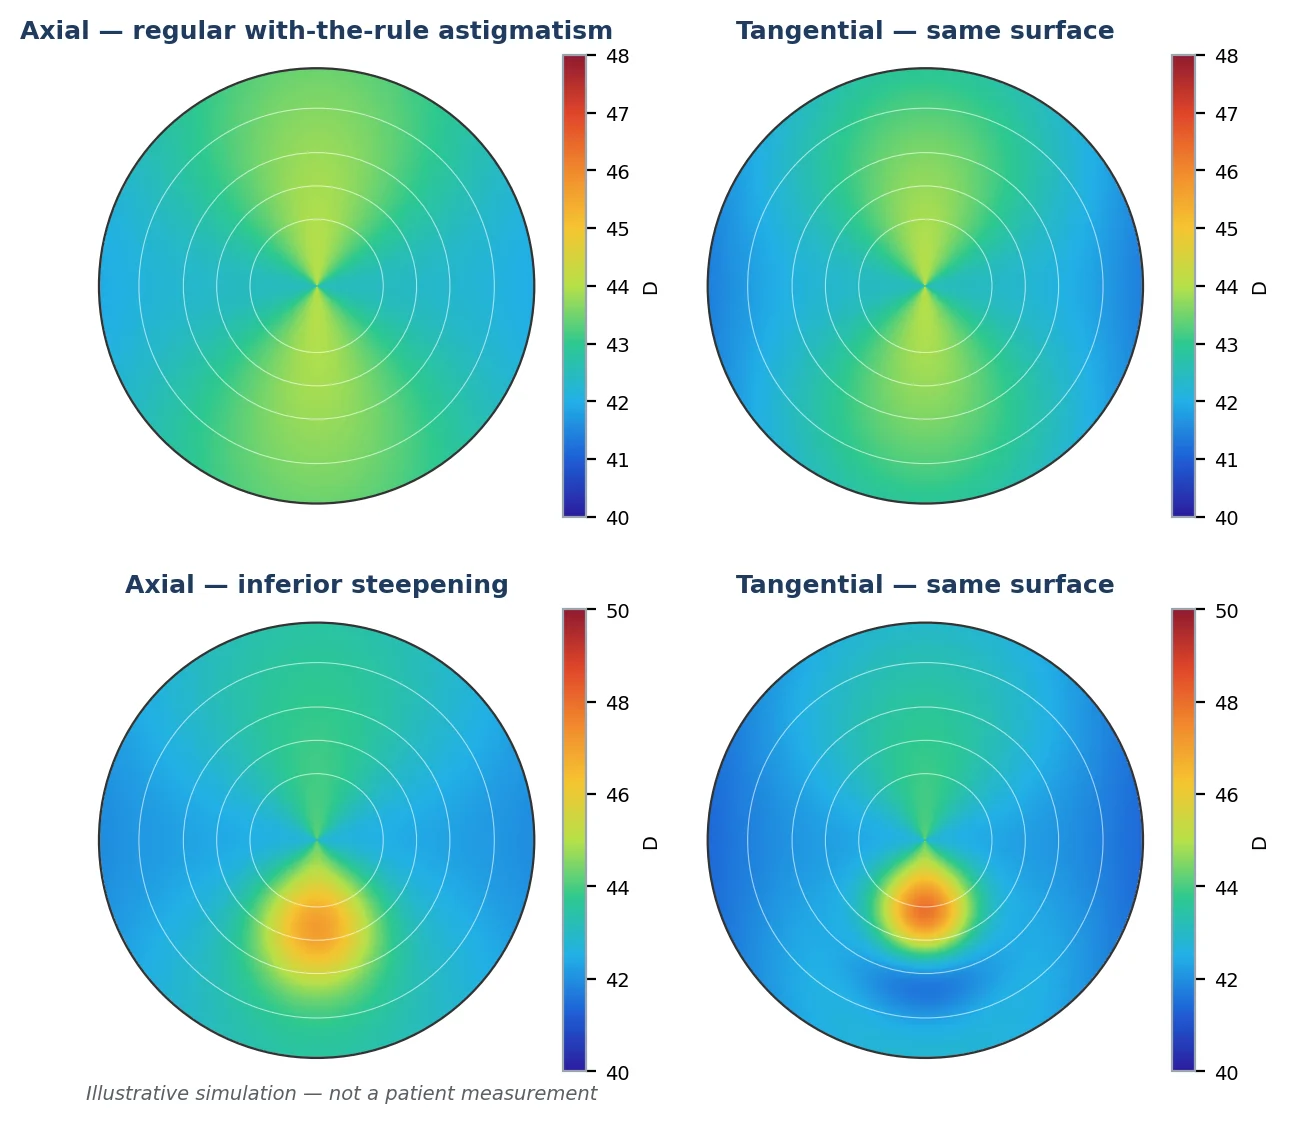
| Axial / sagittal map | Describes curvature with respect to the measurement axis. Useful for the overall pattern and regular astigmatism | Expected: a reasonably smooth, symmetric pattern; a regular bow tie can be normal. Axial maps can make a localised cone appear broader |
| Tangential / instantaneous map | Describes local curvature change. Helps localise focal steepening and treatment-zone boundaries | Expected: coherent, repeatable local shape. More sensitive to local noise, tracing errors and surface disturbance |
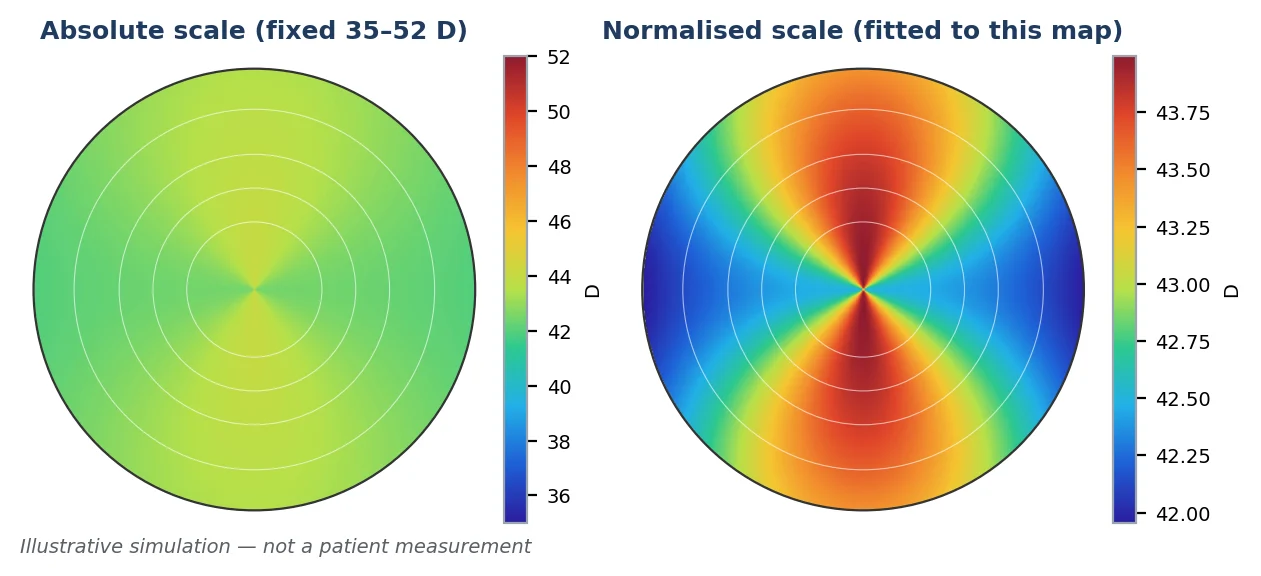
| Absolute scale | A fixed colour-to-value relationship | Use identical scale and unit across visits. A colour is meaningful only after its numerical legend is read |
| Normalised scale / step | Colours are fitted to the examination's range; step is the numerical interval per colour band | No physiological normal. A small step magnifies subtle variation; separately normalised maps can exaggerate apparent change |
| Point D and r | Local dioptric power and curvature radius, typically D and mm | Smaller curvature radius means steeper power. These describe location-specific curvature, not spectacle refraction |
| Point angle and z | Meridian angle and reconstructed axial/altimetric coordinate | Check the display's origin and unit. Raw z is not automatically the same as the HEIGHT residual from a best-fit reference |
| Profile and 3D | Meridional curvature traces and a 3D rendering of the same reconstruction | Useful for explaining shape. Rendering does not add posterior-surface or thickness measurements |
Reproducible inferior or inferotemporal steepening, an asymmetric bow tie, skewed radial axes, a displaced steep region, or new irregularity merit correlation with refraction and slit-lamp examination. A "crab-claw" pattern is not by itself diagnostic of pellucid marginal degeneration; tomography and peripheral examination may be needed. A pattern that appears on one capture and not on a good-quality repeat is, until proven otherwise, a tear-film or alignment effect.
A Placido system samples where the rings reflect, which is dense in the mid-periphery and sparse at the apex; a rotating Scheimpflug camera samples a slit section through the apex and infers the anterior surface from the corneal cross-section. Each reconstructs curvature through different geometry and smoothing. When a CA-800 map and a Pentacam, Sirius or Galilei map of the same eye differ in the location or magnitude of a steep region, the difference can arise from sampling, from the tear film at the moment of capture, or from genuine change between examinations. Do not adjudicate between them by picking the more alarming one; repeat the acquisition on the instrument that will be used for follow-up.
Sources: [1] §§13.6, 14.1, 14.4; [12–14]; [25]; [43].
| Parameter / unit | What it means and why it is used | Expected value / clinical interpretation |
|---|---|---|
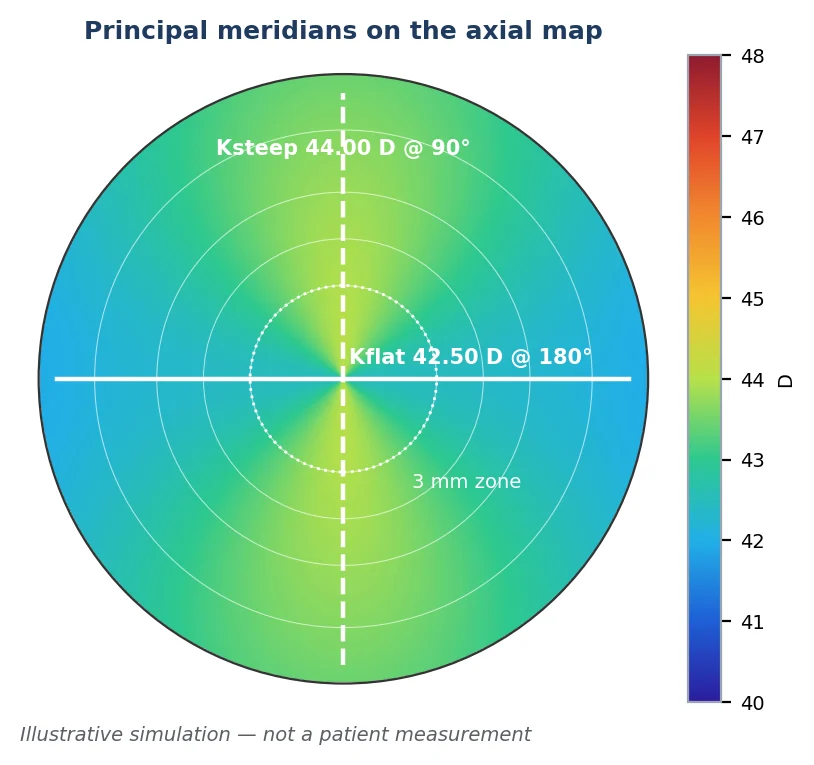
| K1 / Kflat, D or mm | Flatter principal meridian. Its radius is larger than the steeper meridian's radius | Adult central K values are often around 43–44 D; roughly 40–46 D is a broad orientation range, not a validated CA-800 normal interval |
| K2 / Ksteep, D or mm | Steeper principal meridian. Compare with K1 and examine the map | Higher values indicate greater curvature, not necessarily disease. A normal central K does not exclude a peripheral or early cone |
| Mean K / Km, D | A central average when provided; commonly related to the two principal powers | Use the software definition. Averaging radii then converting to D differs slightly from averaging powers |
| Cylinder / Cyl, D | Magnitude of corneal astigmatism, conventionally Ksteep minus Kflat; printed sign may follow plus- or minus-cylinder settings | Zero means no difference between principal powers. Regular non-zero cylinder is common and is not itself keratoconus |
| Axis, degrees | Orientation of the meridian or cylinder convention named in the report | 0° and 180° represent the same meridian. Check whether the label denotes flat K, steep K, plus cylinder or minus cylinder |
| Sim-K | Simulated keratometry based on a central sampling region | Do not assume it equals every 3 mm zone value or another instrument's Sim-K. Match the selected mode in serial records |
| 3 / 5 / 7 mm; 2 / 4 / 6 mm | Zone diameters for the meridian / emimeridian display, depending on settings | Peripheral values need adequate measured coverage. Comparing different diameters can change magnitude and axis without biological change |
| Meridians / emimeridians | Full principal-meridian analysis versus separate half-meridian values | Opposite halves can reveal asymmetry hidden in the combined value. Nasal/temporal labels depend on the eye |
Worked example. Kflat 42.50 D at 180° and Ksteep 44.00 D at 90° give 1.50 D of anterior corneal cylinder and an arithmetic mean of 43.25 D. A steeper vertical meridian is a with-the-rule pattern. This does not prescribe the spectacle cylinder, which includes the rest of the eye's optics.
Corneal power in dioptres on a topographer is a conversion from radius using an assumed refractive index, conventionally n = 1.3375: K(D) = 337.5 / r(mm). An 8.00 mm radius therefore reads 42.19 D. That index is a convention describing the whole cornea as a single refracting surface; it is not a direct measurement of both surfaces, and instruments or software using a different index will print different dioptric values for the same radius. When comparing K between devices, compare radii, or confirm that both use the same index.
Sources: [1] §§14.1.2, 17.3, 17.6; [5] supplies population context, not a CA-800 interval.
| Parameter / unit | What it means and why it is used | Expected value / clinical interpretation |
|---|---|---|
| Astigmatism at 3 and 5 mm | Corneal cylinder and axis calculated over two zones | A smooth regular cornea usually has broadly consistent orientation. A marked zone-dependent change may reflect irregularity, treatment geometry or artefact |
| APP / Pupil Avg, D; 4.5 mm zone | Average corneal power across a specified 4.5 mm pupil area. The word "pupil" names the averaging zone | Expected to be broadly compatible with central K in a regular untreated cornea. It is not pupil diameter or the patient's refractive error |
| Asphericity e / SF / p / Q | Shape descriptor indicating change in curvature from apex to periphery. The main index uses an 8 mm diameter | Normal untreated corneas are often prolate. See the asphericity section for notation and why values at 4.5 and 8 mm differ |
| LSA, D; 4.5 mm zone | Longitudinal spherical aberration: difference in focusing behaviour of rays across the specified corneal zone | No verified universal CA-800 cutoff. It is not interchangeable with a Zernike spherical coefficient or RMS in micrometres |
| Curvature Irreg., SD, D | Curvature irregularity statistic over the 4.5 mm region. The manual describes instantaneous-curvature variation and best-fit residual irregularity | Lower values generally indicate a more regular surface. No validated numerical threshold found; confirm the exact panel definition if comparing exports |
| Asymmetry A, D; directions | Difference between the more curved and flatter hemispheres in a 4.5 mm region. Associated power values and directions identify the contrast | Nearer zero suggests less hemispheric difference. A persistent larger difference warrants image review and clinical correlation |
| SAI, D in manual figure | Surface Asymmetry Index for the 4.5 mm area. A surface-symmetry measure distinct from KC-tab SI | Lower is generally more symmetric. Do not transfer a cutoff from another topographer's SAI, SRI or ISV |
Irregularity and asymmetry can explain ghosting or reduced best-corrected acuity even when mean K is ordinary. They can also be produced by tear breakup, scarring, epithelial disease, contact-lens warpage or prior surgery. Review the spatial pattern and repeat after controlling surface and acquisition factors before attributing it to ectasia.
The Surface Asymmetry Index and Surface Regularity Index were defined on the Tomey TMS series. As described in the literature, the TMS SRI quantifies power-gradient differences between successive ring pairs across 256 semi-meridians, and normal corneas are reported to present SRI values below about 0.56; the TMS SAI averages the power differences between points 180° apart across 128 meridians. The CA-800 manual's SAI is a 4.5 mm-zone asymmetry figure in dioptres. Equivalence between the CA-800 and TMS SAI implementations has not been established, and the reviewed manual does not publish the CA-800 formula; a TMS SRI or SAI threshold should not be transferred to the CA-800 field without validation.
Sources: [1] §14.1.3, including Figs. 44–46; [30]. Manufacturer numeric reference intervals for the CA-800 indices are not given in the reviewed manual.
| Parameter / unit | What it means and why it is used | Expected value / clinical interpretation |
|---|---|---|
| R0 / Ro, mm or converted D | Fitted apical radius/power along the flat meridian, steep meridian and their average | It describes the apex of a fitted conic; it is not necessarily the map's steepest single point |
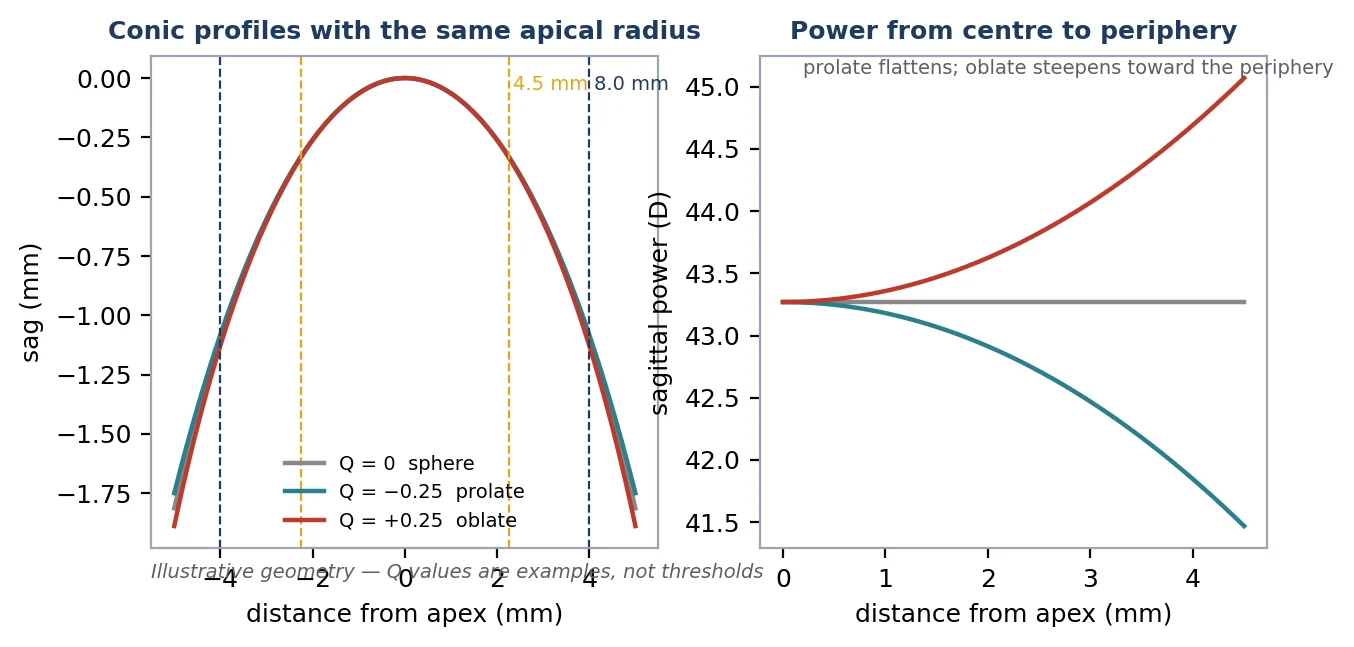
| Q, dimensionless | Conic asphericity: Q = 0 spherical, negative Q prolate, positive Q oblate under the usual convention | A useful central tendency is about −0.2 to −0.3 for an untreated anterior cornea. This is not a diagnostic interval or a CA-800 8 mm limit |
| e, dimensionless | Eccentricity, another expression of conic shape | For a conventional prolate ellipse, Q = −e². Example: e = 0.50 corresponds to Q = −0.25. Do not apply this conversion blindly to signed software conventions for oblate shapes |
| p and SF | Alternative shape notations selectable in CA-800 settings | In common conic notation p = 1 + Q, and SF may mean e² = −Q; the reviewed manual does not define its SF conversion. Confirm before converting or pooling values |
| 8 mm principal meridian values | Fitted curvature, shape and meridian orientation over an 8 mm diameter | Broader sampling characterises peripheral flattening. Missing peripheral rings reduce confidence |
| 4.5 mm values; pupillary asphericity | Corresponding central-zone fits and pupillary surface shape | Compare like diameter with like diameter. A central-zone Q is not a substitute for an 8 mm Q |
| R10, R15, R20, R25, R30 | Peripheral-angle entries for nasal, temporal, inferior and superior half-meridians; horizontal, vertical and overall averages | Depending on settings, entries are eccentricity or sagittal radius. Read units rather than interpreting "R" alone. No universal normal for every sector |
| Surface SD | Departure of measured curvature from its associated aspherical fit | Lower residual irregularity is generally preferable. It is a fit statistic, not thickness or a direct measure of visual acuity |
Asphericity is useful for understanding contact-lens alignment, orthokeratology changes and spherical aberration. A positive postoperative Q can be expected after myopic ablation or corneal reshaping and should not automatically be classified as disease. One healthy-eye study found anterior Q of −0.24 ± 0.10 at 6 mm using a Pentacam; that sampling and instrument differ from the CA-800 and the figure is population context only.
Sources: [1] §14.1.3 and §17.3; [6].
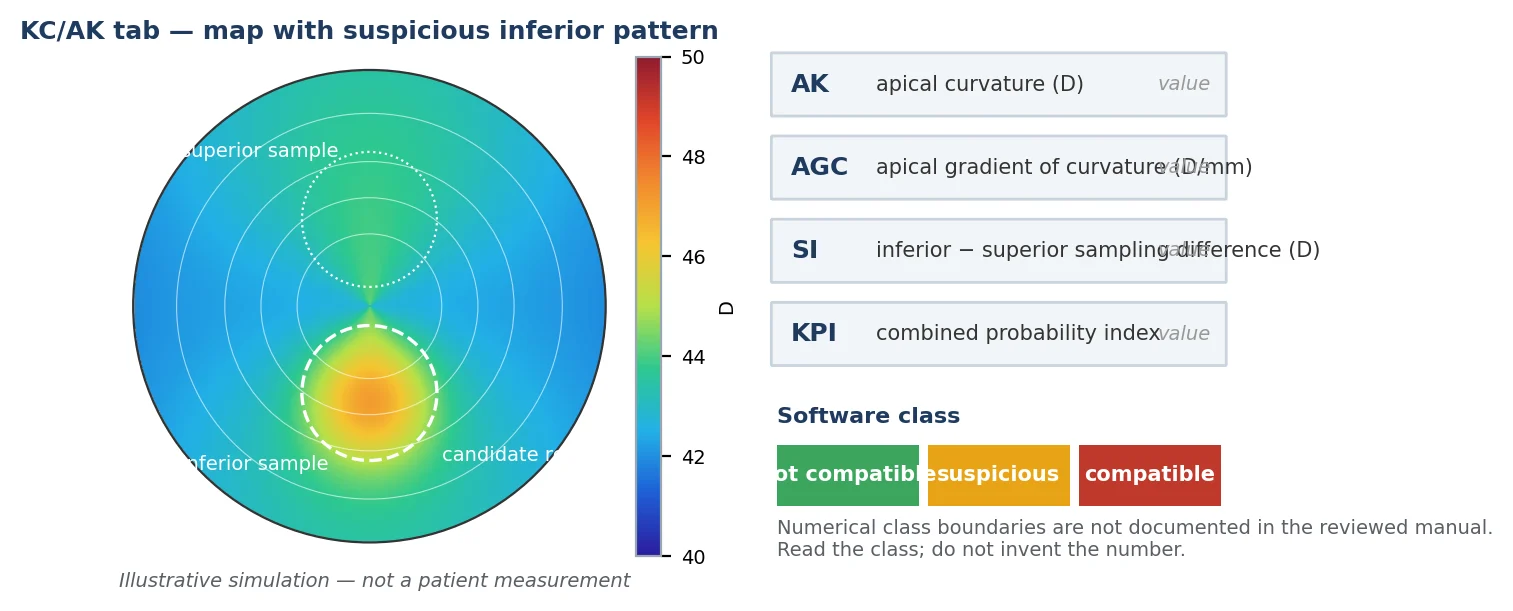
This panel combines shape features to classify whether the anterior topographic pattern is compatible with keratoconus. The colour is an algorithmic classification of the acquired map, not a histological diagnosis or a percentage of tissue damage.
| Parameter / unit | What it means and why it is used | Expected value / clinical interpretation |
|---|---|---|
| AK, D | Apical curvature: corneal power at the apex | Contextually, ordinary central corneal power is reassuring, but AK has no stand-alone diagnostic cutoff verified in the reviewed manual. AK is not automatically Kmax |
| AGC, D/mm | Apical gradient of curvature: average change in corneal power per unit distance, referenced to apical power | A greater gradient can support focal steepening. No numeric CA-800 normal interval is published in the reviewed manual |
| SI, D | Difference between average powers in inferior and superior circular sampling regions positioned on the vertical axis | A value nearer zero represents less imbalance in those regions. Sign and magnitude matter. Do not equate it to a different instrument's I-S formula |
| Kpi / KPI, % on example display | Combined keratoconus probability index interpreted with AK, AGC and SI | Use the accompanying software class. Exact green/yellow/red numerical boundaries are not documented in the reviewed manual; do not invent them |
| Green class | Pattern classified as not compatible with keratoconus | Reassuring only within test sensitivity and scan quality; does not exclude early ectasia or posterior/thickness abnormalities |
| Yellow class | Pattern suspicious for keratoconus | Repeat good-quality scans, investigate lens warpage and surface disease, and consider corneal tomography or referral |
| Red class | Pattern compatible with keratoconus | Requires correlation with history, refraction, slit lamp and tomography. Prior surgery, scars or poor acquisition can affect classification |
Do not substitute familiar cutoffs. K >47 D, I-S >1.4 D, KISA% >100, Pentacam BAD-D ≥1.6 or ≥2.6, the Belin/Ambrósio elevation-difference limits (posterior >16 µm), and other systems' SAI/SRI/ISV thresholds are not definitions of a positive CA-800 KPI. They arise from different parameters, algorithms, instruments and datasets. The section on cross-device indices explains each one and where it belongs.
A reasonable next step for a reproducibly suspicious map is specialist assessment with tomography and pachymetry, especially in a young patient, an eye with increasing irregular astigmatism, or before corneal refractive surgery.
The 2015 Global Consensus on Keratoconus and Ectatic Diseases, as quoted in the 2025 literature reviewing it, agreed that abnormal posterior elevation and abnormal corneal-thickness distribution are mandatory to diagnose keratoconus, and that posterior elevation abnormalities must be present to diagnose mild or subclinical disease. A 2025 review of 29 studies concluded that the evidence does not in fact support the claim that posterior abnormalities must be present to diagnose subclinical keratoconus. An Edition 2 of the consensus was published in Cornea in 2026 with revised definitions; its specific diagnostic statements were not accessible for this edition and are not summarised here.
What this means at the CA-800: the device sees only the anterior surface, so whichever way the consensus debate settles, a CA-800 class is at most one component of an ectasia assessment. A red or yellow class earns tomography; a green class in a young patient with progressive astigmatism, a family history, or a refractive-surgery request does not close the question.
Sources: [1] §14.1.4; [12–14]; [32]; [33].
Figure 8 · The CLMI outputs
How the cone-location fields relate to the map.
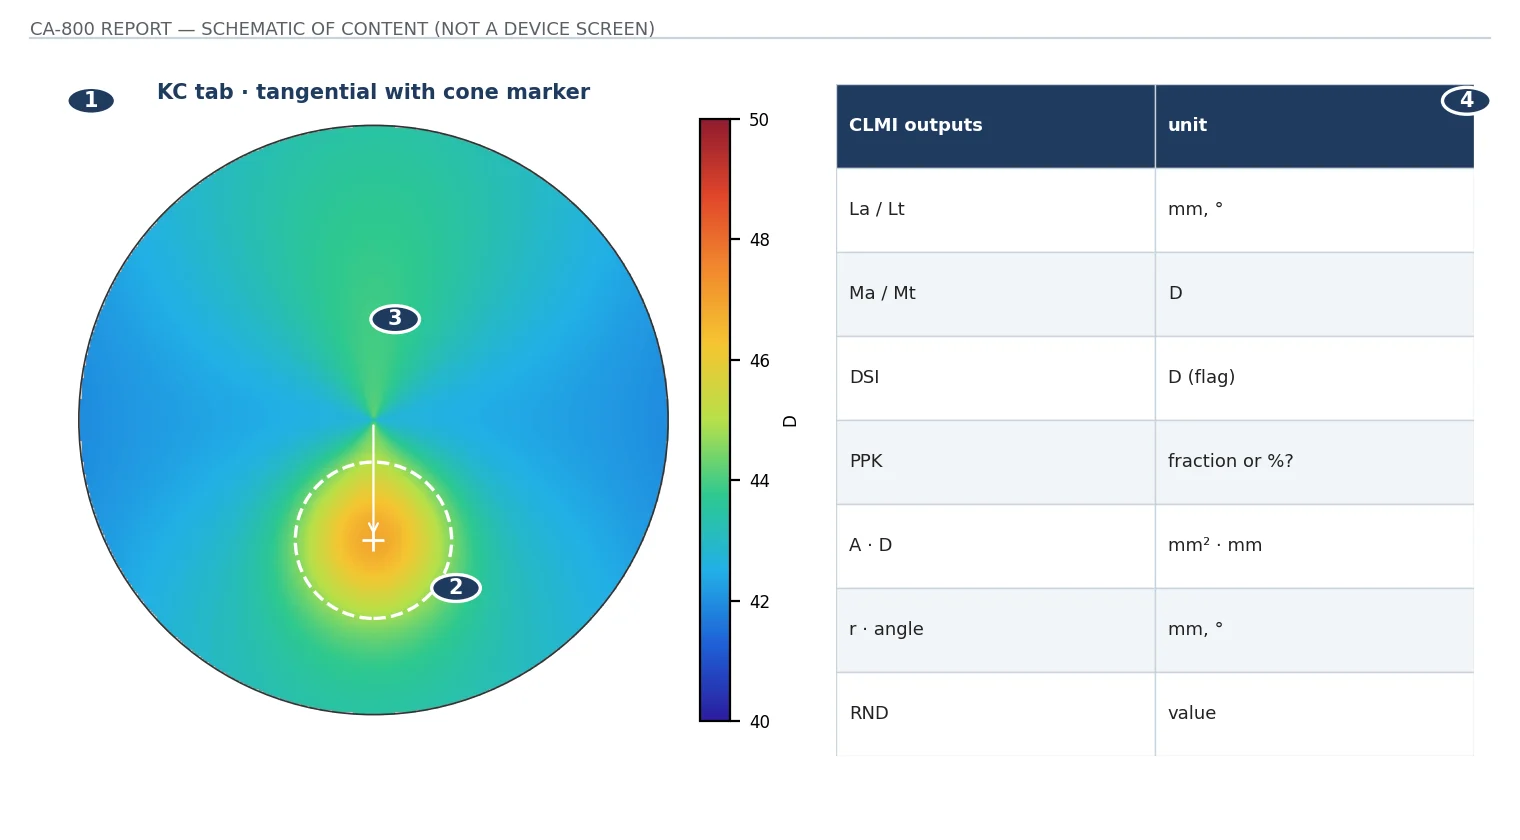
Schematic of the report’s documented content drawn from the manual’s field list; values are illustrative and the layout is not a reproduction of the device screen.
| Parameter / unit | What it means and why it is used | Expected value / clinical interpretation |
|---|---|---|
| La / Lt, mm and degrees | Location of the candidate steep region in axial (a) and tangential (t) analyses | No normal location threshold. A location becomes clinically meaningful when the associated magnitude and pattern suggest a cone |
| Ma / Mt, D | Axial and tangential CLMI magnitude measures describing localised steepening relative to the surrounding map | A more pronounced focal contrast can strengthen suspicion. Axial and tangential magnitudes are not interchangeable |
| DSI, D on manual figure | Differential Sector Index. The reviewed manual supplies its name but not the full formula or a numerical normal limit | Retain the exact label, value and flag. Do not reinterpret it using an unrelated system's differential-sector calculation |
| PPK | Percent Probability Keratoconus associated with CLMI | A model-derived screening output. Verify whether the software displays a fraction or a percent before transcribing; the manual example lacks an explicit % suffix |
| A, mm² | Area of the algorithm-identified cone, shown when the KC pattern is suspicious or compatible | No healthy target or validated disease-stage boundary. It tracks the region identified by this algorithm, not histological lesion area |
| D, mm | Average diameter of the identified cone | No general normal range. Do not confuse this D with dioptres; the printed unit resolves the ambiguity |
| r and angular coordinate | Distance and direction of the cone's barycentre relative to the map centre | Location aids reproducibility and lens planning. Distinguish this r from curvature radius and from CLMI's candidate-region location |
| RND | Circularity factor of the identified cone | Describes shape. The reviewed manual does not specify a normalised scale or a diagnostic limit; do not assume that "1" is the required normal value |
The original CLMI research sought localised steepening on axial and tangential maps and tested discrimination on Keratron and TMS-1 datasets. Its published performance cannot be treated as a prospective validation of every CA-800 software version or of subclinical disease. Later work on CLMI-X and zonal Kmax in keratoconus progression describes repeatability for those specific implementations, which are not the CA-800 CLMI. Report the map pattern, classification and clinical corroboration together.
Sources: [1] §14.1.4, Figs. 47–48; [12]; [14].
Figure 9 · The HEIGHT report
What the elevation report contains and which settings determine the residual.
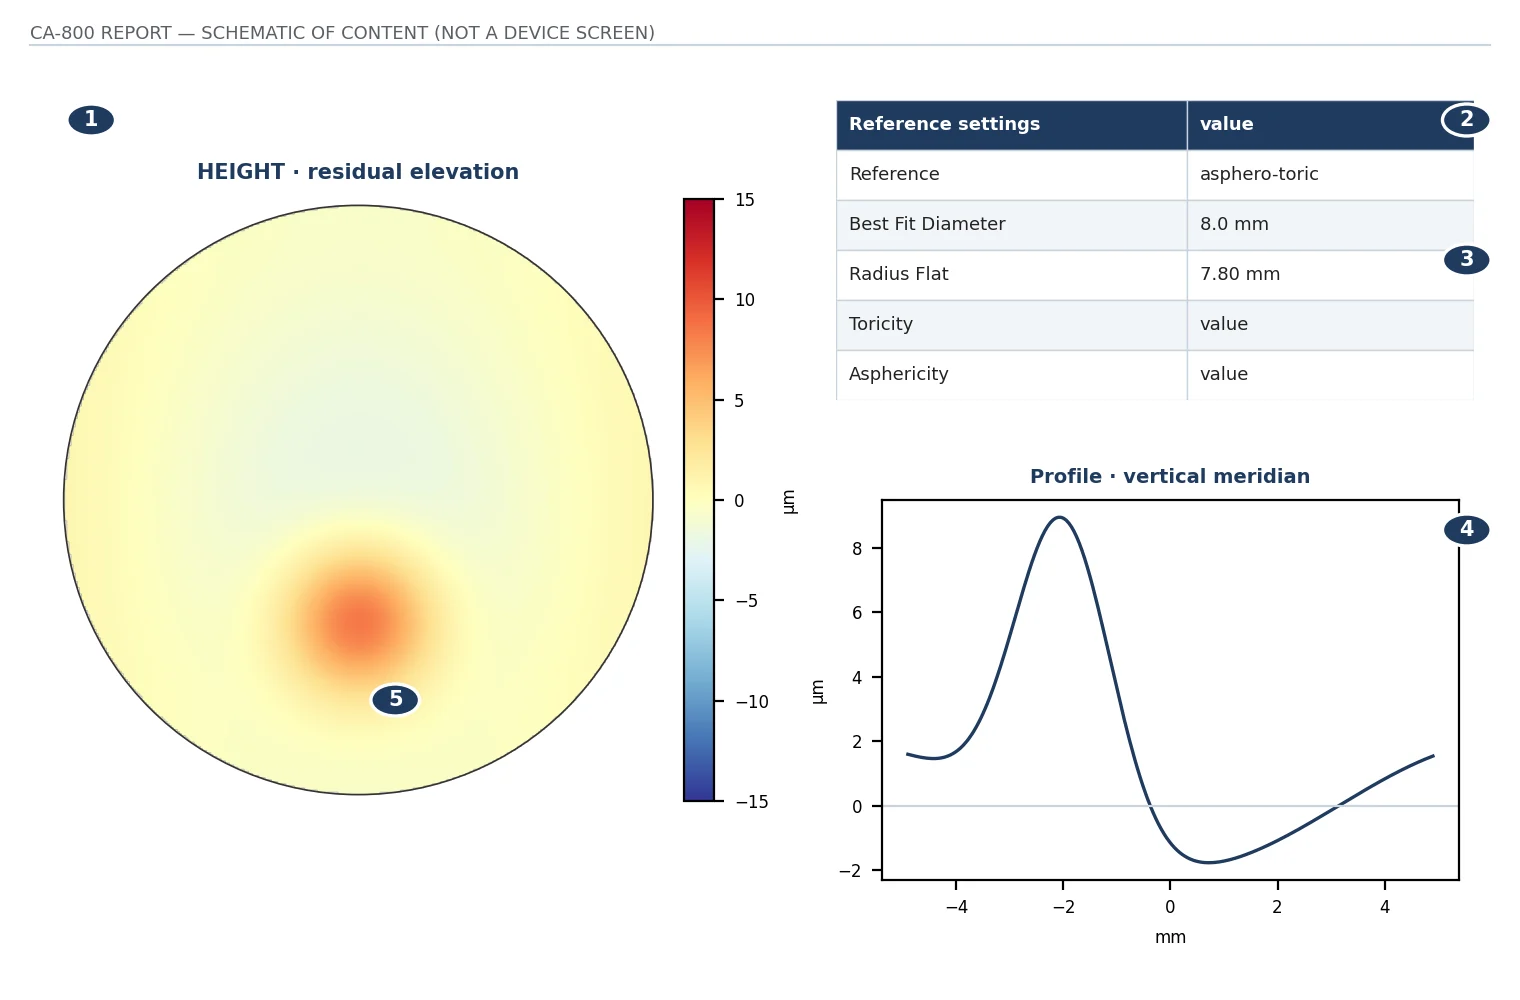
Schematic of the report’s documented content drawn from the manual’s field list; values are illustrative and the layout is not a reproduction of the device screen.
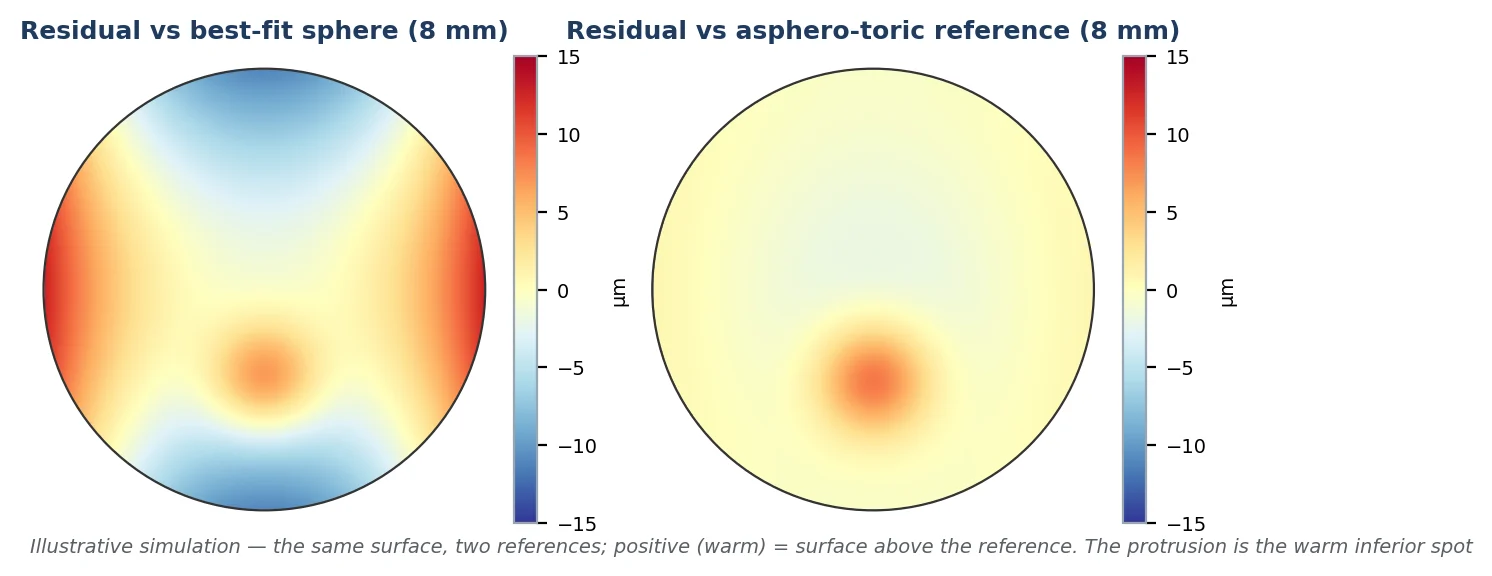
A height report answers: how far does the reconstructed anterior surface depart from the chosen reference surface? It does not answer how thick the cornea is. Changing the reference changes the residual elevation even if the eye has not changed.
| Parameter / unit | What it means and why it is used | Expected value / clinical interpretation |
|---|---|---|
| Height / elevation, usually µm | Signed distance between the reconstructed anterior surface and a corresponding reference-surface point | Near-zero residual means close to the selected fit. There is no universal ±µm normal limit independent of fit diameter, surface and instrument |
| Spherical reference | Best-fit or user-adjusted sphere; Radius Flat controls radius | Useful for displaying departures from a simple sphere. Regular astigmatism can create substantial residuals |
| Aspherical reference | Conic surface with radius and asphericity parameters | Accounts for normal peripheral shape change. Residuals are not directly comparable with a spherical reference |
| Asphero-toric reference | Reference incorporating radius, toricity and asphericity | May remove regular toricity and expose remaining irregular shape. A smaller residual partly reflects the more flexible fit |
| Best Fit Diameter, 3–8 mm | Area used to estimate the reference surface | No physiological normal. Record the same diameter across serial analyses; a larger or smaller fit area changes the residual pattern |
| Radius Flat / Toricity / Asphericity | Parameters defining the fitted or manually adjusted mathematical reference | These are reference-model parameters, not independent measurements of posterior cornea or stromal integrity |
| Point r and angle | Radial distance from image centre and angular position of the selected point | Coordinates localise the residual. Here r is a map position, not the curvature radius on the MAP screen |
| Profile / 3D / Differential | Meridional traces, surface rendering, or comparison with a prior reconstruction | Inspect scale and reference consistency. Profile display choices of 5, 10 or 50 µm are plotting scales, not clinical severity categories |
Clinical significance. A reproducible localised protrusion may support an irregular anterior-surface finding. Ectasia assessment still requires information not captured here, especially posterior shape and corneal thickness distribution. Never apply a Pentacam posterior-elevation threshold to this report.
The OCULUS Pentacam interpretation guide gives colour limits for the elevation-difference charts of the Belin/Ambrósio Enhanced Ectasia Display — the change in elevation between the standard best-fit-sphere map (8.0 mm zone) and the enhanced-reference map that excludes the thinnest region: anterior <5 µm green, 5–7 µm yellow, >7 µm red; posterior <12 µm green, 12–16 µm yellow, >16 µm red. These are not limits for raw elevation above a best-fit sphere. They are defined for a difference between two specific reference surfaces, on Scheimpflug data, for both surfaces, on the Pentacam's reconstruction. The CA-800 HEIGHT report is a single anterior residual from Placido reflection against whichever reference the operator selected at whichever fit diameter. Nothing in it corresponds to the Belin/Ambrósio difference parameter, and a 16 µm anterior residual on a CA-800 asphero-toric fit at 6 mm carries no relationship to the Pentacam red band.
Sources: [1] §14.4; [13–14]; [25].
Figure 11 · The COMP / DIFF report
What the comparison report contains.
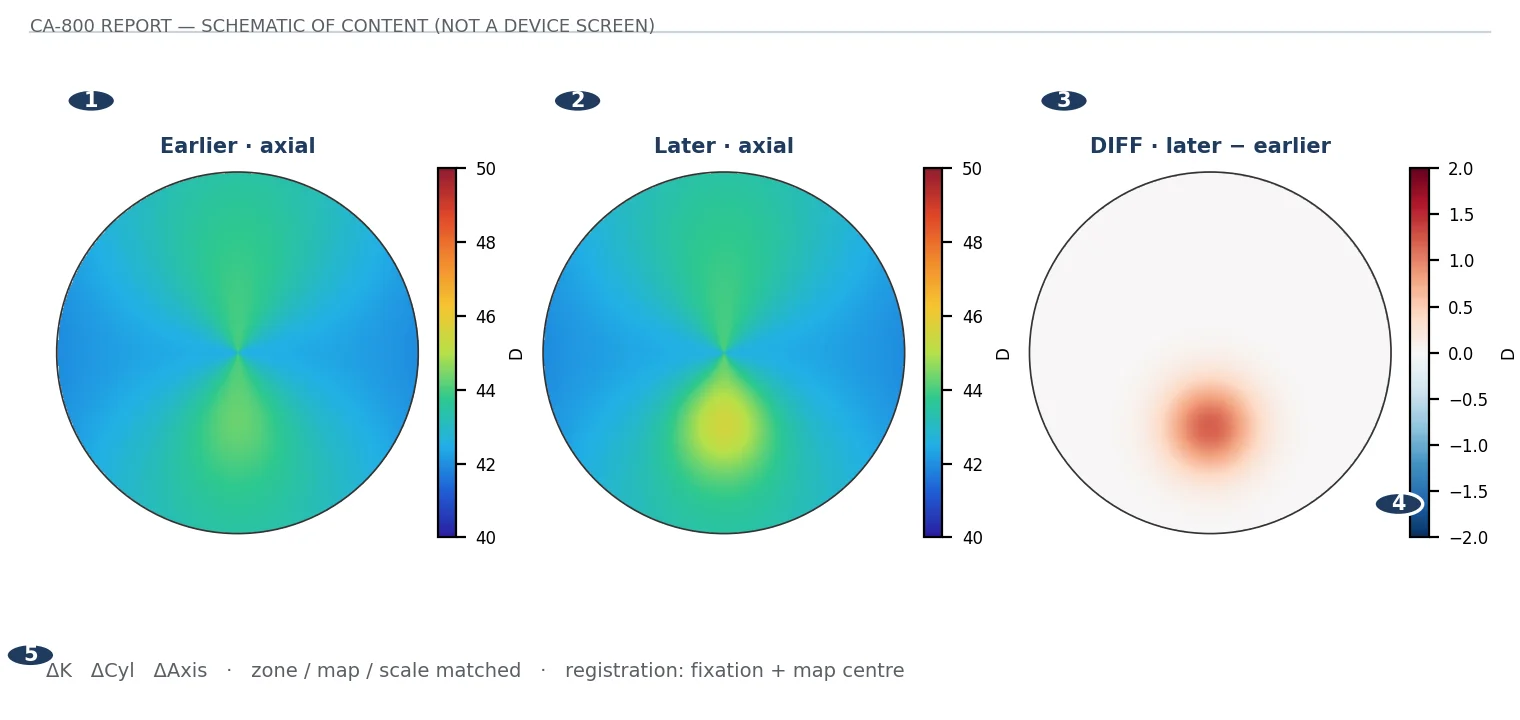
Schematic of the report’s documented content drawn from the manual’s field list; values are illustrative and the layout is not a reproduction of the device screen.
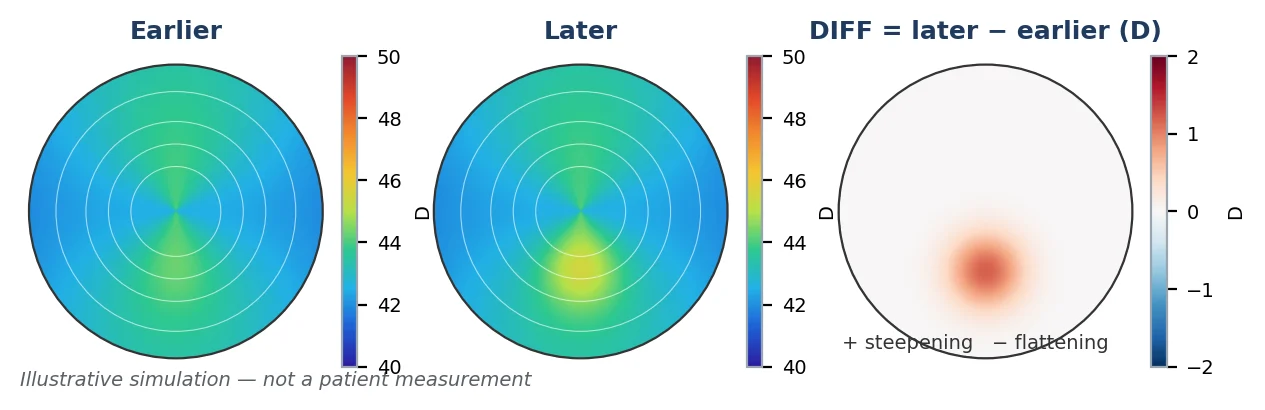
| Parameter / unit | What it means and why it is used | Expected value / clinical interpretation |
|---|---|---|
| OD/OS comparison | Both eyes displayed side by side | Useful for symmetry. The manual disables DIFF across fellow eyes; treat interocular comparison separately from longitudinal subtraction |
| COMP | Current and selected prior examination for the same patient | Verify that both maps refer to the same eye and that the intended baseline is selected |
| DIFF / difference map | Pointwise difference between two selected topographic examinations | Read the subtraction order and units. Under "later minus earlier" in D, positive means steepening and negative means flattening |
| Difference in radius | Change displayed in mm rather than D | Sign reverses its curvature implication: a larger radius means flatter power. Do not interpret every positive colour as steepening |
| Delta K / cylinder / axis | Changes in matching numerical fields | No universal clinically significant threshold for all CA-800 parameters. Changes must exceed repeatability and be consistent with morphology |
| Zone / map / scale | Sampling diameter, axial versus tangential computation, and legend | Match these before comparing. Changes of pupil size also invalidate a simple comparison of aberration RMS |
| Registration / coverage | Fixation, map centre, head position and included corneal region | A shifted treatment zone or apparent peripheral change may come from alignment or coverage differences |
Repeated anterior steepening or increasing irregularity can raise concern for progression. A single colour change, a one-time index shift, or a change equal to display resolution cannot establish it. Use repeated high-quality measurements, symptoms, refraction and visual acuity; add tomography and pachymetric assessment when evaluating ectasia.
After cross-linking, laser surgery or orthokeratology, interpret the result against that intervention's expected course. Early remodelling, lens wear and tear instability can confound the comparison. A flatter anterior map alone does not establish restored biomechanics or complete disease stability.
The CA-800 manual does not publish a repeatability figure for its curvature outputs in the reviewed sections, and no peer-reviewed CA-800 topographic repeatability study was identified for this edition. Until one is available, obtain two or three acceptable acquisitions at each visit as a quality check: if they disagree with one another, a between-visit difference of similar size cannot be interpreted. The same-visit spread is not a statistical threshold for progression, because it does not capture variability from visit conditions, operator, alignment and surface state. Progression requires a change that exceeds appropriately established measurement variability, is reproduced on repeat, and is supported by clinical findings.
Illustrative wording: "Repeatable inferotemporal steepening is present on matched tangential maps. Corneal tomography and clinical progression assessment are warranted; anterior topography alone does not establish the full ectasia profile."
Sources: [1] §§14.2, 14.5; [13–14].
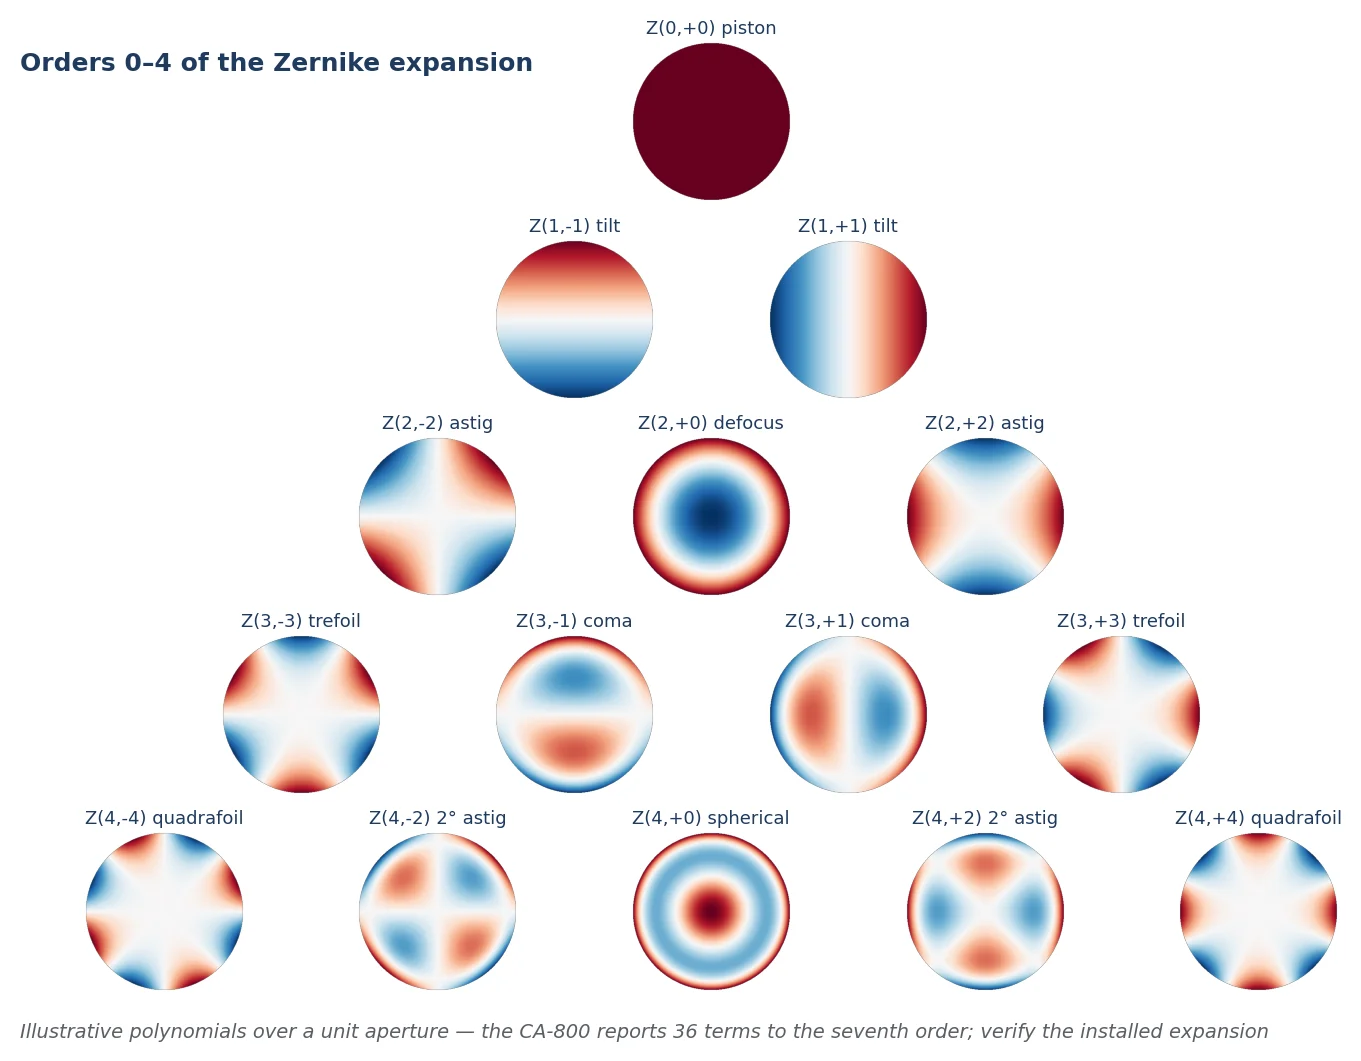
Zernike analysis expresses wavefront error as a sum of mathematical components. The CA-800 derives these from the anterior cornea. It does not directly measure the crystalline lens, posterior corneal contribution, retinal function or the entire eye's wavefront.
| Parameter / unit | What it means and why it is used | Expected value / clinical interpretation |
|---|---|---|
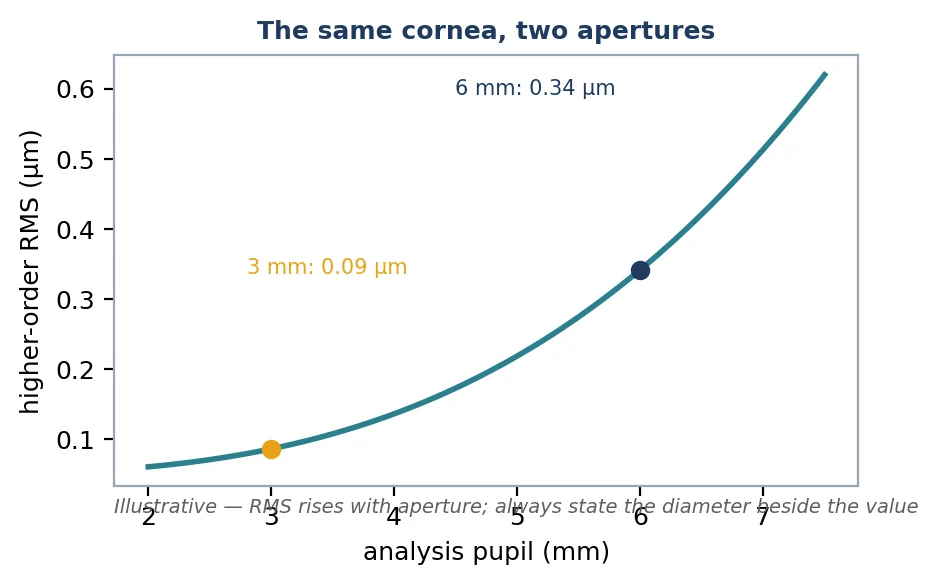
| Analysis pupil, 2–7.5 mm selectable | Aperture over which the corneal wavefront is analysed | A setting, not a healthy-eye target. Larger apertures commonly expose more aberration. Always state diameter with an RMS value |
| Zernike coefficient, usually µm | Signed amplitude of one polynomial; identified by radial order n and angular frequency m or a software index | Zero means absence of that modelled component, not necessarily the ideal value for the whole eye. Verify normalisation and indexing when comparing systems |
| Order 0 piston; order 1 tilt | Constant optical-path offset and first-order wavefront tilt | Reference/alignment terms. Their inclusion or removal changes what "total" describes; they are not disease severity scores |
| Order 2 defocus; astigmatism | Lower-order focusing error and meridional power difference; astigmatism has paired oriented components | Non-zero values are common. Corneal-derived defocus/astigmatism cannot replace manifest refraction |
| Order 3 coma | Asymmetric aberration; paired horizontal/vertical components | An increased repeatable coma pattern can explain directional smearing or monocular ghosting. No universal CA-800 diagnostic µm limit |
| Order 3 trefoil | Threefold asymmetric aberration represented by paired components | Can contribute to complex image distortion. Interpret magnitude at a fixed aperture and in context of other terms |
| Order 4 spherical Z(4,0) | Rotationally symmetric primary spherical aberration; signed coefficient differs from its non-negative RMS | A normal anterior cornea need not have zero spherical aberration; internal optics can partly compensate it |
| Other order 4–7 terms | Secondary astigmatism, quadrafoil and higher terms when included in the displayed expansion | No validated individual normal limits identified. High-order terms become vulnerable to missing coverage and noise |
RMS. With orthonormal coefficients and the same included terms, RMS is the square root of the sum of their squared amplitudes. It is non-negative; the sign of an individual coefficient carries directional/shape information that RMS discards.
One frequently cited study of 228 eyes measured anterior corneal aberrations with a Placido topographer (Humphrey Atlas) over the central 6.0 mm zone and reported mean higher-order RMS (third to sixth order) of 0.479 ± 0.124 µm, spherical-aberration RMS of 0.281 ± 0.086 µm (the fourth- and sixth-order terms combined, Z(4,0) and Z(6,0)) and coma RMS of 0.248 ± 0.135 µm (third- and fifth-order terms combined), with the primary spherical coefficient Z(4,0) positive in every cornea (0.280 ± 0.086 µm) and higher-order and coma RMS increasing with age. Those values describe that instrument, that aperture and that population. They are useful for judging whether a CA-800 figure is in an ordinary range for its aperture, and useless as a pass/fail line; the CA-800 aperture, term set and normalisation must all be checked before any such comparison, and a CA-800 primary-coma or primary-spherical coefficient alone should not be compared with these combined-order RMS values.
Sources: [1] §14.3; [3] describes the 36-polynomial, seventh-order implementation; [35].
Figure 14 · The ZER report
What the optical-quality displays contain.
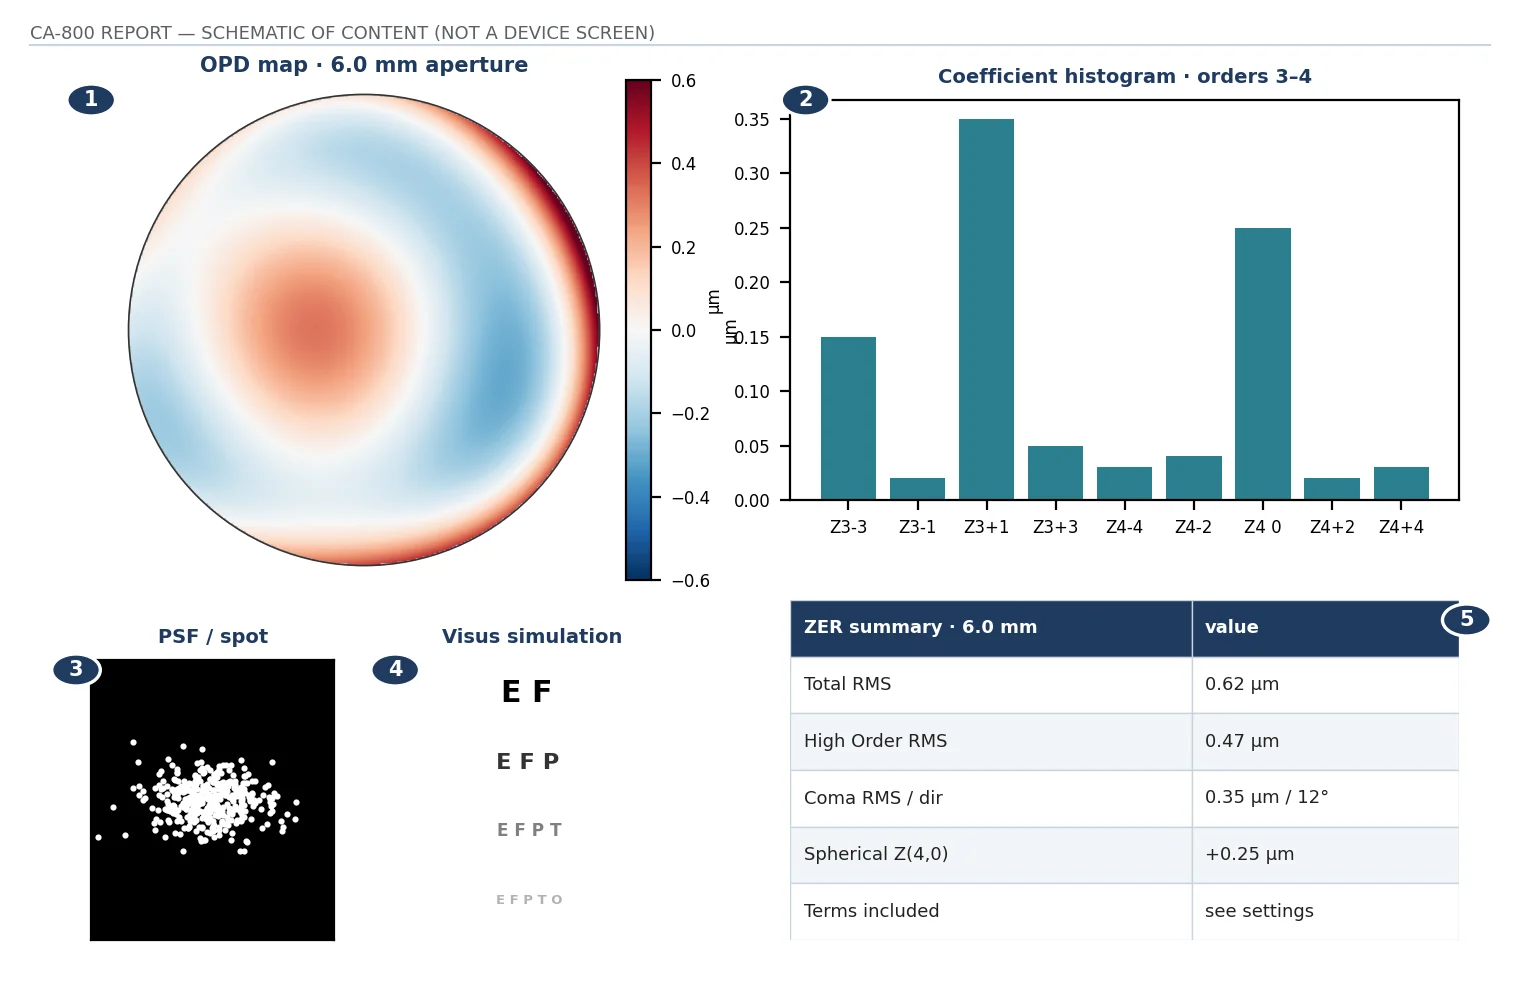
Schematic of the report’s documented content drawn from the manual’s field list; values are illustrative and the layout is not a reproduction of the device screen.
| Display | What it means and why it is used | Expected value / clinical interpretation |
|---|---|---|
| OPD map / total RMS, µm | Optical path difference across the selected aperture and its aggregate deviation from the chosen wavefront reference | Lower residual error generally favours sharper optics. "Total" depends on the included terms and software reference; no universal CA-800 normal cutoff |
| Astigmatism map | Magnitude in D, axis and associated RMS | Corneal astigmatism may be regular and correctable. D and RMS are different descriptions, not numerically interchangeable |
| Spherical map | Longitudinal spherical aberration in D and associated RMS in µm | Interpret using the stated diameter. Do not compare 0.60 D of LSA with 0.60 µm of RMS as if equal |
| Coma map / direction | Combined coma effect, its RMS and orientation | A persistent large contribution supports asymmetric optical distortion. Direction can help identify a decentred optical pattern |
| High Order map | Software grouping of residual components beyond its named primary groups | The manual's "High Order" wording is not identical to an explicit "all n ≥ 3" definition. Confirm included terms before comparing with another device's HOA RMS |
| Coefficient histogram / pyramid | Magnitude and distribution of Zernike components; contrast encodes coefficient size | A visual summary of the same reconstruction. It is not an additional independent diagnostic test |
| PSF / spot diagram | Modelled point spread and ray distribution at the image plane from the anterior-corneal calculation | A compact point/spot is optically favourable. There is no validated CA-800 PSF pass/fail range |
| Visus / low-contrast ETDRS or Landolt C | Simulated high- or low-contrast target degradation | Educational illustration, not measured best-corrected acuity or contrast sensitivity. Retina, lens, scatter and neural processing alter actual vision |
Analyse the same good-quality scan at a smaller and a larger aperture to explore whether the anterior corneal optics plausibly contribute to night symptoms. For treatment follow-up, use the same aperture, centre and coefficient definition on both visits. If symptoms exceed the corneal explanation, examine tear dynamics, lens opacity, refraction and the posterior segment.
Sources: [1] §14.3. No universal CA-800 HOA, coma, PSF or simulated-acuity reference interval was verified.
Figure 16 · The PUP report
What the pupillometry report contains.
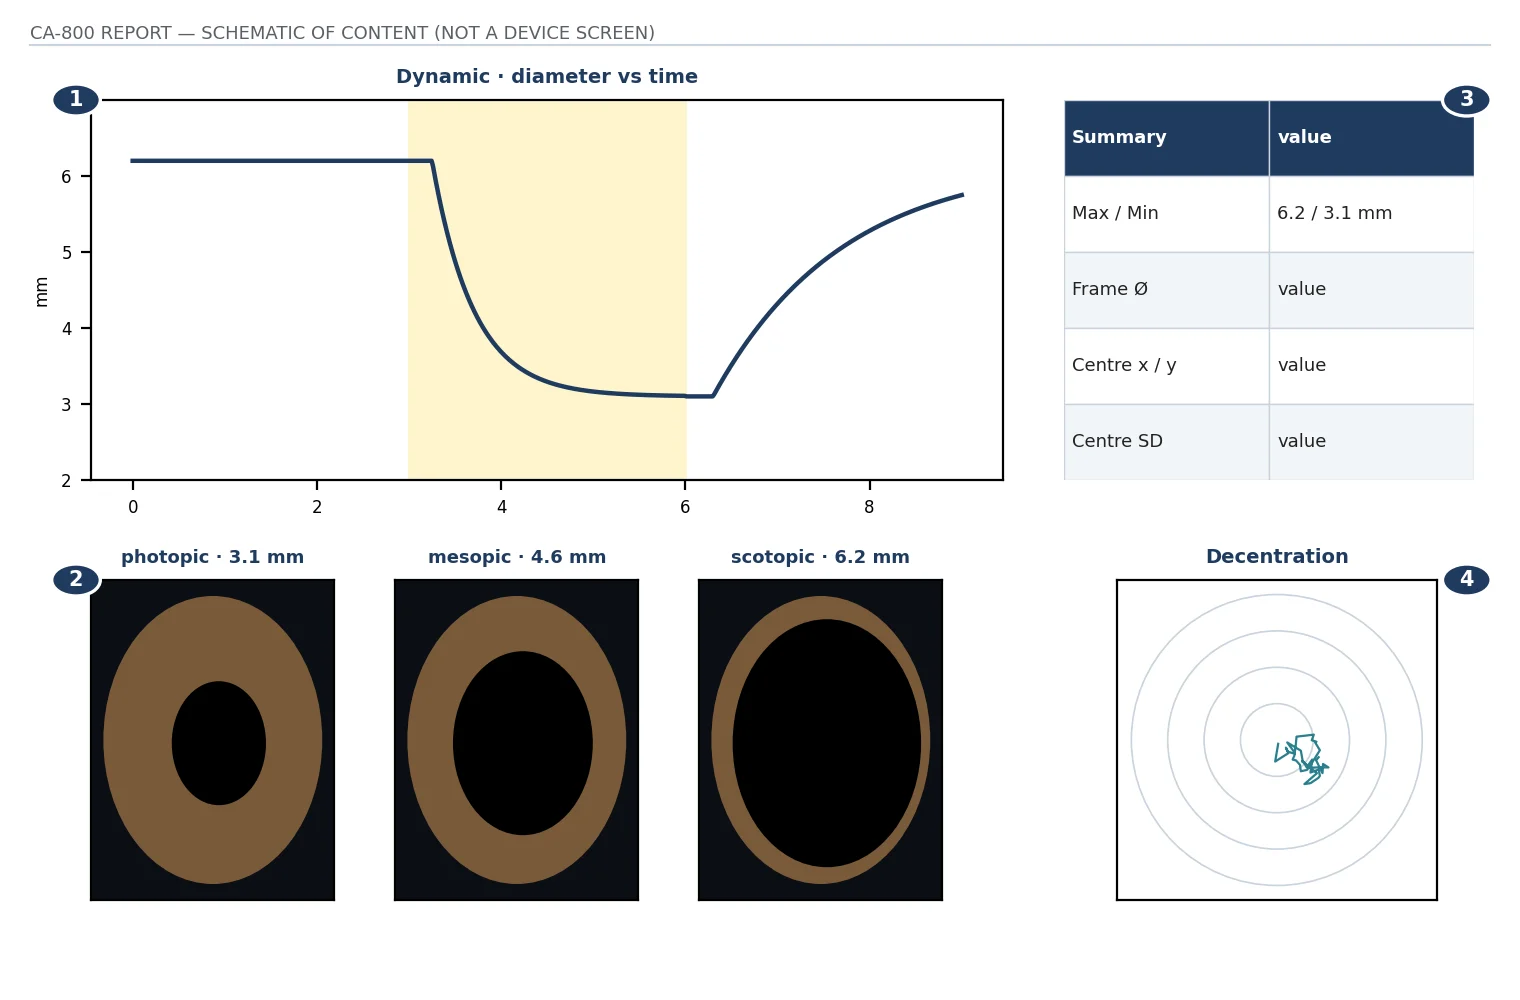
Schematic of the report’s documented content drawn from the manual’s field list; values are illustrative and the layout is not a reproduction of the device screen.
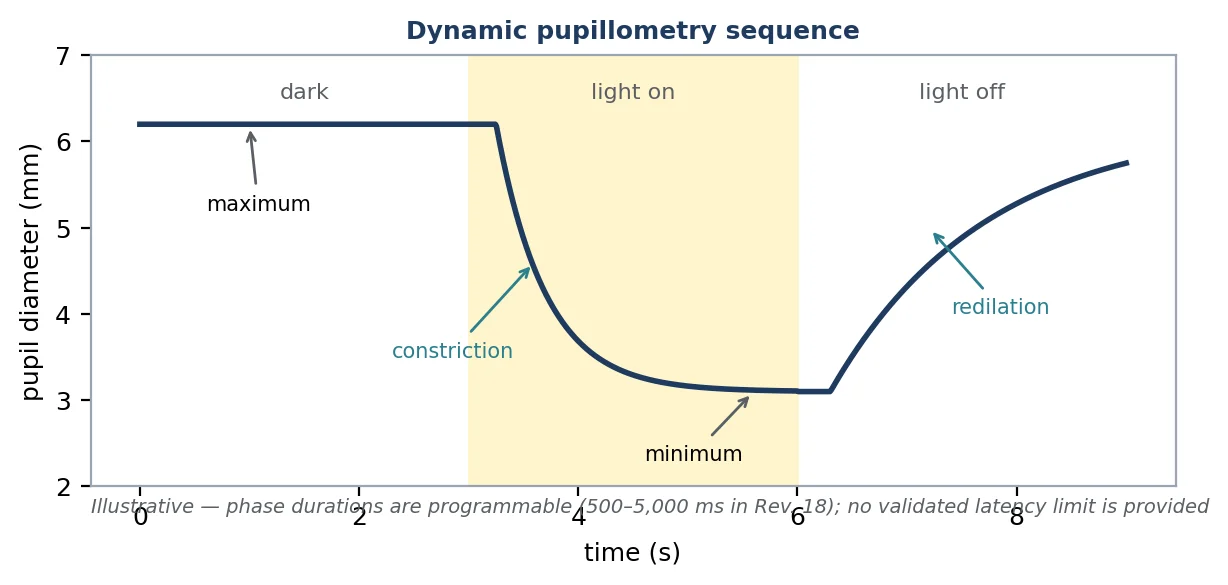
| Parameter / unit | What it means and why it is used | Expected value / clinical interpretation |
|---|---|---|
| Photopic / mesopic / scotopic diameter, mm | Mean pupil diameter across frames in a bright, intermediate or dark acquisition condition | Expected direction: photopic smaller than mesopic and scotopic. Absolute diameter depends on age, illumination, adaptation and medication |
| Dynamic maximum / minimum, mm | Largest and smallest pupil diameters during the illumination sequence | Quantifies excursion under that protocol. Rev. 18 uses an "Average" panel heading for this summary; do not assume every value is an arithmetic mean |
| Frame diameter, mm | Pupil size at the currently selected frame | A time-specific observation, not the sequence average. A blink or boundary error can create an outlier |
| Pupil centre x / y, mm | Cartesian position of the pupil centre for the sequence summary or selected frame | No universal healthy x/y cutoff. Read the reference origin and axis directions rather than equating this with anatomical visual-axis measurement |
| Pupil-centre SD, mm | Variation in pupil-centre coordinates across the acquisition | Small variation may reflect stable fixation; greater variation can reflect movement, physiological change or edge-detection error |
| Decentration graph | Trajectory of the pupil centre relative to the fixation reference, with concentric distance guides | Useful for pupil/optical-zone alignment. It is not a direct angle-kappa, angle-alpha or strabismus measurement |
| Latency graph | Pupil diameter versus time through dark, light-on constriction and light-off redilation phases | The plot shows response dynamics. Do not assume a separately validated numerical latency or neurological score is provided |
| Statistics graph | Within-acquisition distribution: mean, 25th–75th and 10th–90th percentiles, plus outlying frames | These describe that patient's sampled frames. They are not age-matched population normative percentiles |
Record room conditions, adaptation, medications and the programmed light/dark durations. Rev. 18 permits phase settings from 500 to 5,000 ms; changing them changes the observed response. In poorly tracked images, correct the acquisition before interpreting asymmetry or an abnormal curve.
| Feature | Expected reference or behaviour | Clinical significance / limitation |
|---|---|---|
| Bright / photopic | Often approximately 2–4 mm in adults | Broad orientation only. A smaller pupil in an older person can be physiological; medication and the exact stimulus matter |
| Intermediate / mesopic | Often approximately 3–6 mm | A wide overlapping range. Do not classify a patient from a label such as "mesopic" without knowing light level and adaptation |
| Dark / scotopic | Often approximately 4–8 mm | Larger apertures may expose peripheral corneal aberrations or exceed a treated optical zone. Size alone does not predict night-vision complaints |
| Constriction / redilation | Pupil becomes smaller with light and enlarges after its removal | Compare shape and timing under matched settings. No CA-800-specific diagnostic latency or velocity limit was verified |
| Anisocoria | Small stable differences can be physiological; roughly ≤1 mm is a common clinical heuristic | New, symptomatic, lighting-dependent or poorly reactive asymmetry requires clinical assessment. Magnitude alone cannot establish benignity |
| Centration | No single normal displacement limit | Consider pupil size, optical-zone position, symptoms and the procedure or lens design. A measurable offset need not be pathological |
One research pupillometer study of 245 healthy participants reported mean pupil diameter 5.39 ± 1.04 mm at 0 lux, 4.70 ± 0.97 mm at 4 lux and 2.84 ± 0.50 mm at 250 lux. These are sample means and standard deviations, not diagnostic ranges, and the CA-800 lighting sequence is not established as equivalent to those conditions.
What this test cannot establish. Routine CA-800 pupillometry is not a substitute for a swinging-flashlight assessment of an afferent defect, a neuro-ophthalmic examination, or a validated neurological pupillometer. New anisocoria with ptosis, diplopia, severe headache or other neurological symptoms merits urgent assessment rather than interpretation from a printout alone.
Sources: [1] §§13.7, 14.6, 17.5; [7]. Broad size ranges are orientation values, not instrument thresholds.
Figure 18 · WTW and the P tab
What the diameter and centration fields contain.
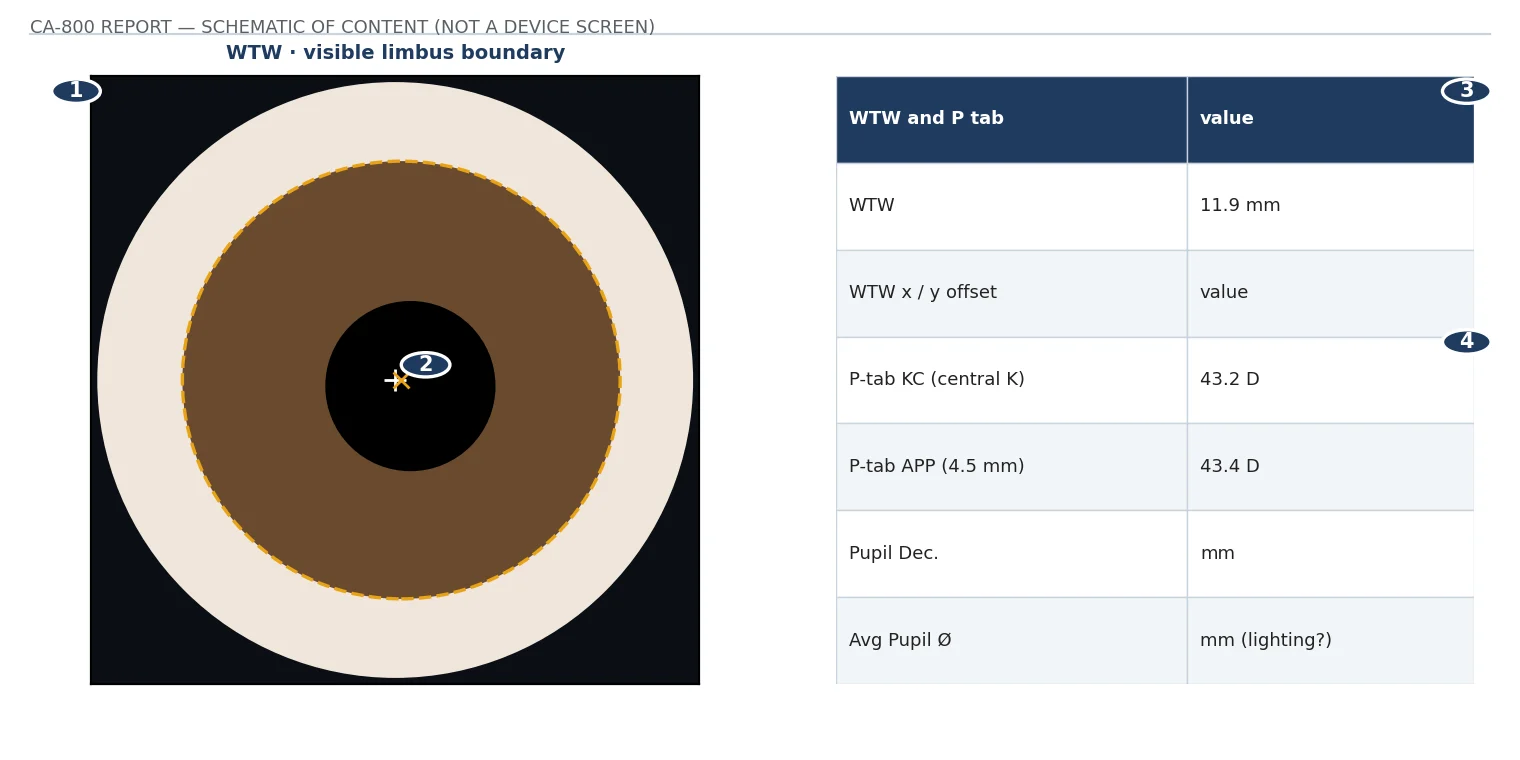
Schematic of the report’s documented content drawn from the manual’s field list; values are illustrative and the layout is not a reproduction of the device screen.
| Parameter / unit | What it means and why it is used | Expected value / clinical interpretation |
|---|---|---|
| WTW / corneal diameter, mm | Visible limbus-to-limbus corneal diameter inferred from the image | Many adult measurements fall around 11–12.5 mm. The device, visible limbus boundary, age and population affect the result |
| WTW x/y offset / decentration | Offset of the limbus/iris centre from the fixation reference. Manual changes to boundary markers update the result | No universal normal limit. It helps geometric planning but is not a direct sulcus-to-sulcus or angle-to-angle measurement |
| P-tab KC, D | Central keratometry in this particular pupil-related panel | This KC label means central corneal power; it does not mean a positive keratoconus diagnosis |
| P-tab APP, D | Average power over the defined 4.5 mm area | Compare with central corneal power and pattern. The 4.5 mm analytical diameter is not necessarily the measured pupil diameter |
| Pupil Dec., mm | Pupil offset from the instrument's stated reference | Interpret with the image and reference markers. Do not convert a linear distance to an angle without a valid geometric model |
| Avg Pupil Ø, mm | Mean pupil diameter associated with the acquisition | Use the actual lighting condition. A MAP image pupil is not automatically a fully dark-adapted PUP measurement |
WTW helps contextualise the relationship between corneal size and a selected contact-lens diameter. Combined with topography, it supports initial geometric planning. It does not describe the full scleral shape or establish the final scleral-lens landing-zone fit. One healthy adult Saudi sample measured with Pentacam AXL Wave had WTW 11.95 ± 0.39 mm; that is population context, not a CA-800 reference interval. A visibly unusual diameter should be verified at the slit lamp or with a second method before attaching a congenital or acquired diagnosis.
Common error: a manually drawn visible limbus is not the anatomical ciliary sulcus. WTW alone must not be treated as a direct measurement of the internal diameter used for implant sizing.
Sources: [1] §§14.1.5, 14.8; [8].
Figure 19 · The TBT Summary report
What the non-invasive breakup report contains.
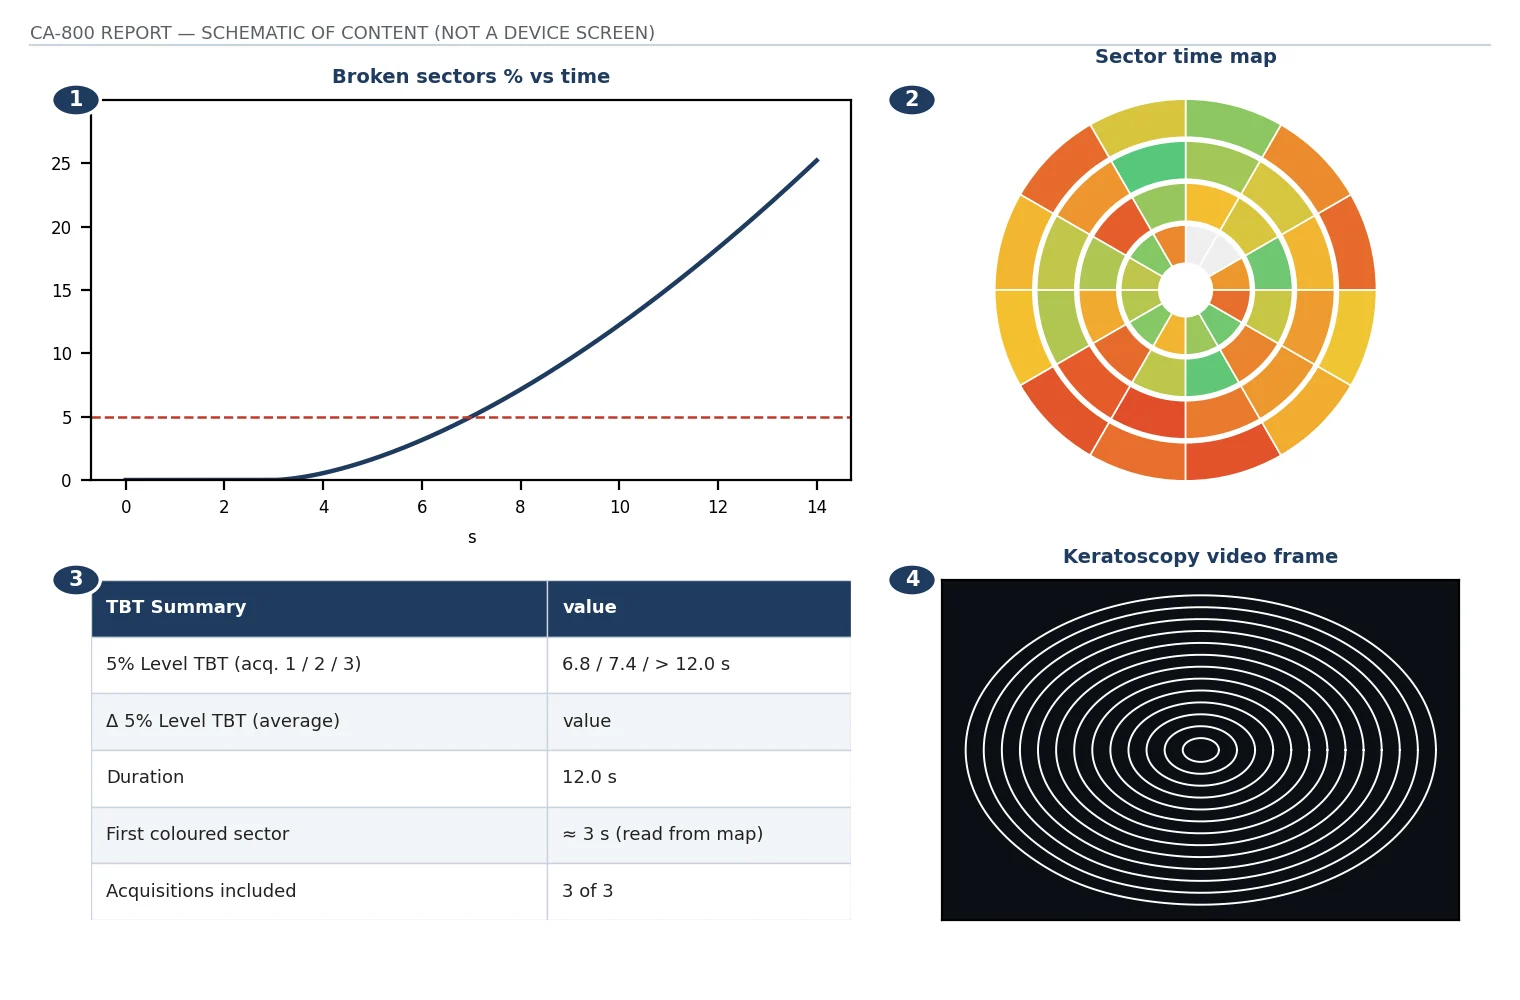
Schematic of the report’s documented content drawn from the manual’s field list; values are illustrative and the layout is not a reproduction of the device screen.
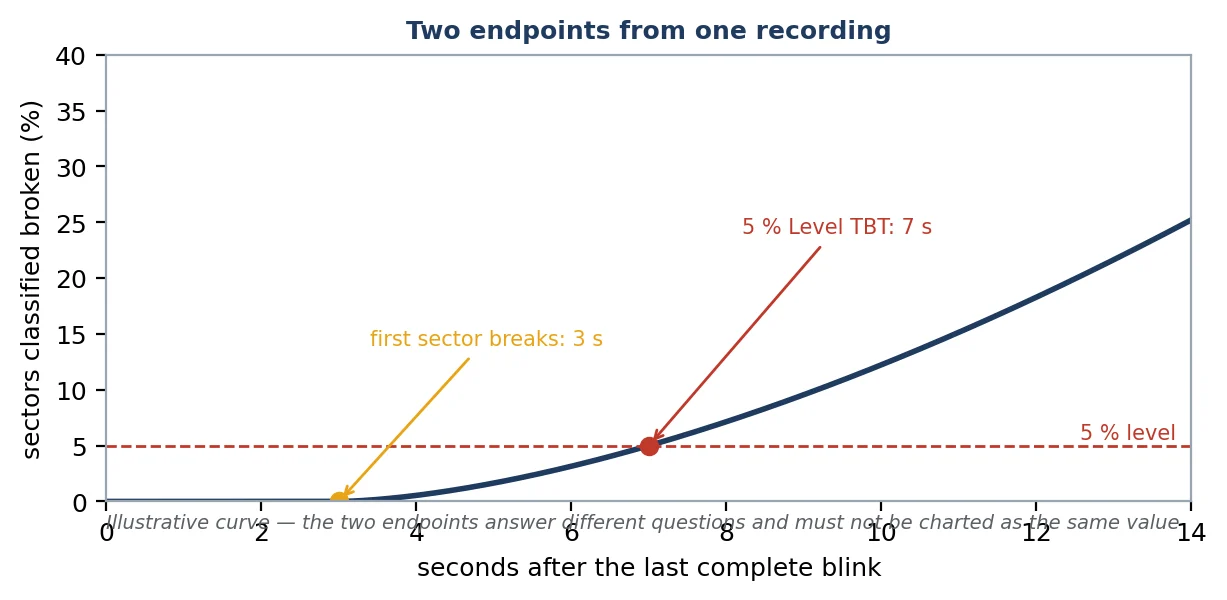
Non-invasive breakup assessment observes changes in the reflected ring pattern after a blink. It evaluates surface stability without adding fluorescein. However, different instruments and software versions do not necessarily define "breakup time" in the same way, and this is the single most consequential definitional trap in the ocular-surface reports.
| Parameter / unit | What it means and why it is used | Expected value / clinical interpretation |
|---|---|---|
| First-break NIBUT | Time from the last complete blink to the first detected non-invasive tear breakup | TFOS DEWS III uses NIBUT <10 s as one sign of loss of homeostasis in its diagnostic pathway, together with a positive symptom screen |
| CA-800 5% Level TBT | In the reviewed software, time until 5% of analysed sectors are classified as broken | It need not equal the first-sector time. No validated universal CA-800 5%-endpoint normal/abnormal cutoff was identified |
| CA-800 Δ 5% Level TBT | Average of the 5%-endpoint times from included acquisitions | The Δ label is the software's summary notation here; it does not mean change from the previous visit |
| Sector average map | For each sector with detected breakup, an average breakup time across acquisitions | A spatial average is not the same as averaging all corneal sectors into a first-break time. Uncoloured sectors need image review |
Consider an illustrative acquisition in which the first sector breaks at 3 s and the 5% level is reached at 7 s. Both numbers are correct; they answer different questions. The first-break time describes the earliest focal instability; the 5% time describes when a defined proportion of the analysed surface has become unstable. A report that prints only the 5% figure has not measured what a first-break instrument measures.
Applying the 10-second reference. Document exactly which endpoint was measured. A 5% value below 10 s supports rapid instability if the acquisition is valid, but a 5% value above 10 s does not exclude an earlier focal breakup. Do not label it "normal NIBUT" solely from that threshold.
The 2025 TFOS DEWS III Diagnostic Methodology report recommends screening with the OSDI-6 questionnaire at a cut-off score of ≥4. A positive result together with one of the following gives a diagnosis of dry eye: a non-invasive breakup time <10 s; or tear-film hyperosmolarity (≥308 mOsm/L in either eye or an interocular difference >8 mOsm/L); or >5 corneal fluorescein and/or >9 conjunctival lissamine-green punctate spots and/or lid-margin lissamine-green staining of ≥2 mm length and ≥25% width. Note that these are the DEWS III criteria; the DEWS II (2017) symptom thresholds of OSDI ≥13 or DEQ-5 ≥6 have been superseded and should not be quoted as current.
The CA-800 can contribute the NIBUT sign to that pathway only if the endpoint it reports corresponds to the "non-invasive breakup time" the report intends. DEWS III does not, in the accessible abstract, specify a first-break versus proportional endpoint, and the 10 s threshold was developed largely from first-break measurements on other instruments. A CA-800 5% Level TBT below 10 s is therefore a supportive but not a formally equivalent sign. Record the endpoint alongside the value in every chart entry.
The OCULUS Keratograph 5M reports NIKBUT, and a clinical evaluation of the device describes it as measuring "the first time the tears break up anywhere on the cornea"; the same study found Keratograph NITBUT was shorter than a Tearscope measurement by 12.35 ± 7.45 s on average and that 63% of subjects had a NITBUT below 5 s. The Medmont E300 offers a tear-film analysis that captures an image sequence after a blink and analyses changes in surface quality. Each of these uses its own detection algorithm, sampling area, frame rate and endpoint. A patient measured on two of them will receive two different numbers for reasons that have nothing to do with the tear film.
Three peer-reviewed observations frame the reliability of the CA-800 NIBUT output.
The practical reading of these three results: in the one direct comparison, made through a contact lens, the CA-800 reported shorter times than a subjective method with repeatability of several seconds; in a symptomatic sample its readings were short; and a single value correlates poorly with symptoms. No study of CA-800 breakup repeatability on the uncovered cornea was identified. A short CA-800 breakup time is a finding to corroborate, not a diagnosis to record.
Sources: [1] §14.11; [4]; [15–16]; [22]; [23]; [24]; [40].
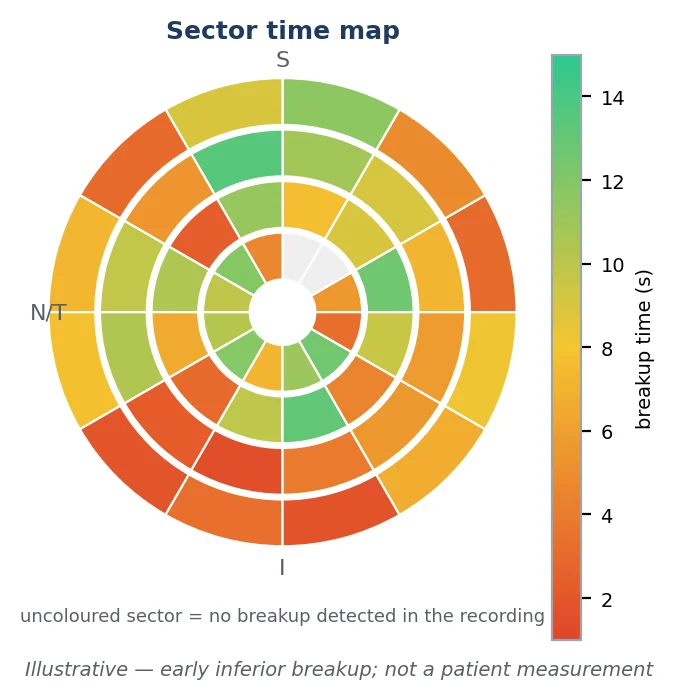
| Parameter / unit | What it means and why it is used | Expected value / clinical interpretation |
|---|---|---|
| 5% Level TBT, s | Time at which the broken-sector proportion first reaches 5% in one acquisition | Longer usually indicates more stable coverage under that protocol. Interpret against repeated results, symptoms and the actual movie |
| Duration, s | Length of the analysed interval. Rev. 18 permits acquisition up to 30 seconds | Short observation limits interpretation. Inability to hold the eye open is not the same as a measured breakup endpoint |
| > Duration | The 5% endpoint was not reached before recording ended | A lower bound, not an exact number. "> 20 s" must not be converted to exactly 20 s, zero, or a missing result |
| Broken sectors, % | Proportion classified as disrupted at a specified time; displayed as a time curve | Compare curves at matched elapsed times. There is no established universal normal curve or percent at every time point |
| Sector time map | Spatial timing: earlier breakup tends toward red, later toward green in the summary | Repeated early regions can explain focal surface vulnerability. An uncoloured sector means no detected breakup in the recorded data, not proven lifelong stability |
| Acquisition inclusion | Checked acquisitions contribute to the summary; unchecking changes averages and the report | Exclude only for a documented quality reason. Otherwise selection can bias the result toward apparent improvement |
| Keratoscopy / Break / Map video | Raw video, breakup overlay, or time-resolved axial/tangential topography | Use raw video to distinguish real tear change from lid intrusion, movement and focus loss |
| Wavefront video / RMS, µm | Time-varying OPD, astigmatism, spherical aberration, coma or high-order residuals | Rising aberration after a blink can support tear-related visual fluctuation. No validated universal normal rate of rise is established |
The manual describes automatic restart if a second blink occurs within five seconds. Therefore, review the saved interval in a patient who blinks very early; an unrecorded or restarted attempt is not evidence that stability exceeded five seconds. Record lens-on versus lens-off conditions and do not pool those measurements.
Sources: [1] §§13.9.4, 14.11; [15–16].
Figure 22 · The Blink report
What the blink analysis contains.
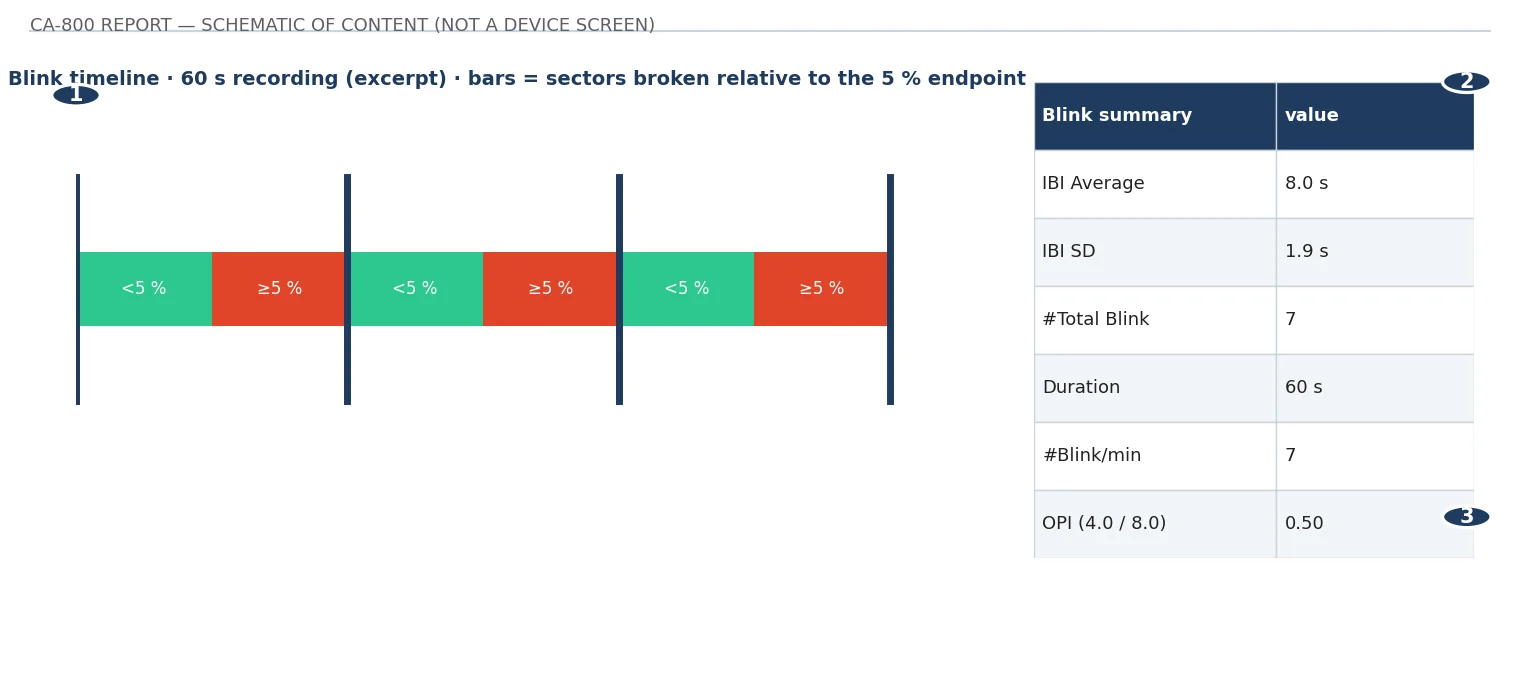
Schematic of the report’s documented content drawn from the manual’s field list; values are illustrative and the layout is not a reproduction of the device screen.
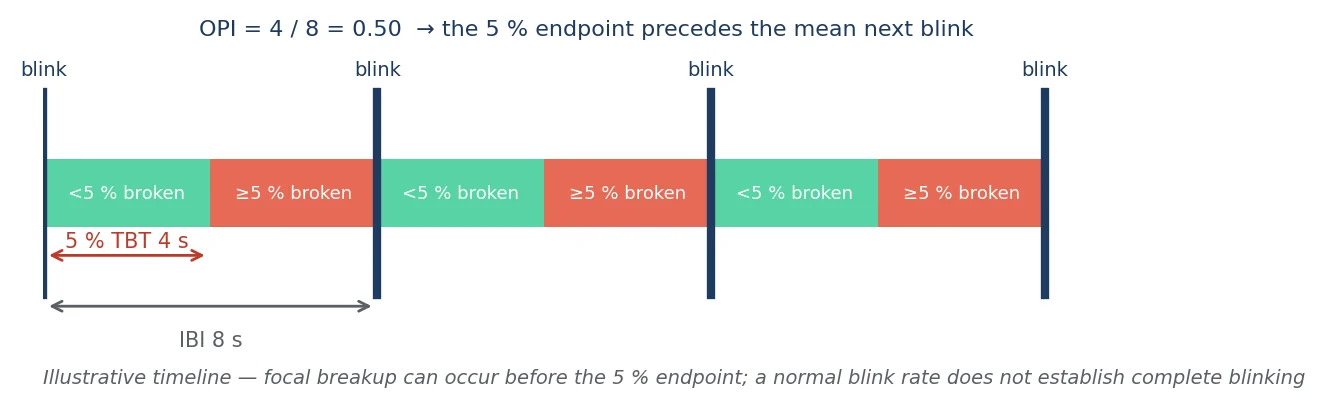
| Parameter / unit | What it means and why it is used | Expected value / clinical interpretation |
|---|---|---|
| IBI Average, s | Mean interval between detected consecutive blinks. Used as the denominator of OPI | Shorter intervals replenish tears more often; long intervals may permit exposure. No fixed normal interval applies to every task |
| IBI SD, s | Variability of the intervals, not uncertainty of the mean | Large variation suggests irregular blinking or acquisition problems; inspect whether long pauses are hidden by the average |
| #Total Blink | Number of detected blinks during the analysed recording | No normal total independent of recording length. Verify automatic detection if the count seems inconsistent with observation |
| Duration, s | Total analysed blink recording time. Manual maximum is five minutes | Longer representative observation may capture behaviour better, but the task and instructions must remain comparable |
| #Blink/min | Blink count normalised to one minute | Quiet-awake rates are often roughly 10–20/min but vary substantially. Reading commonly lowers the rate; conversation can increase it. This is not a diagnostic interval |
| OPI, dimensionless | CA-800 5% Level TBT divided by mean IBI; the summary uses the average 5% TBT | <1: the 5% endpoint occurs before the mean next blink. ≥1: it occurs at/after that interval; this does not guarantee absence of earlier focal exposure |
| Blink completeness | Clinical observation of whether the lids fully redistribute tears | The reviewed report does not specify an automatic incomplete-blink percentage. A normal rate does not establish complete blinking |
Worked examples. TBT5% = 4 s and IBI = 8 s gives OPI = 0.50. TBT5% = 12 s and IBI = 4 s gives OPI = 3.0. These explain timing; they do not independently grade dry-eye severity. If the numerator is ">20 s" and IBI = 4 s, the derived OPI is ">5", not exactly 5.
The original OPI concept used breakup time relative to the interblink interval. The CA-800's 5% numerator can miss earlier focal loss of protection. Rev. 18 also retains only one blink acquisition for both eyes; the latest replaces the previous one. Thus eye-specific OPI values may share the same denominator.
Sources: [1] §§13.9.3, 14.11; [10–11].
Figure 24 · The TMH report
What the meniscus report contains.
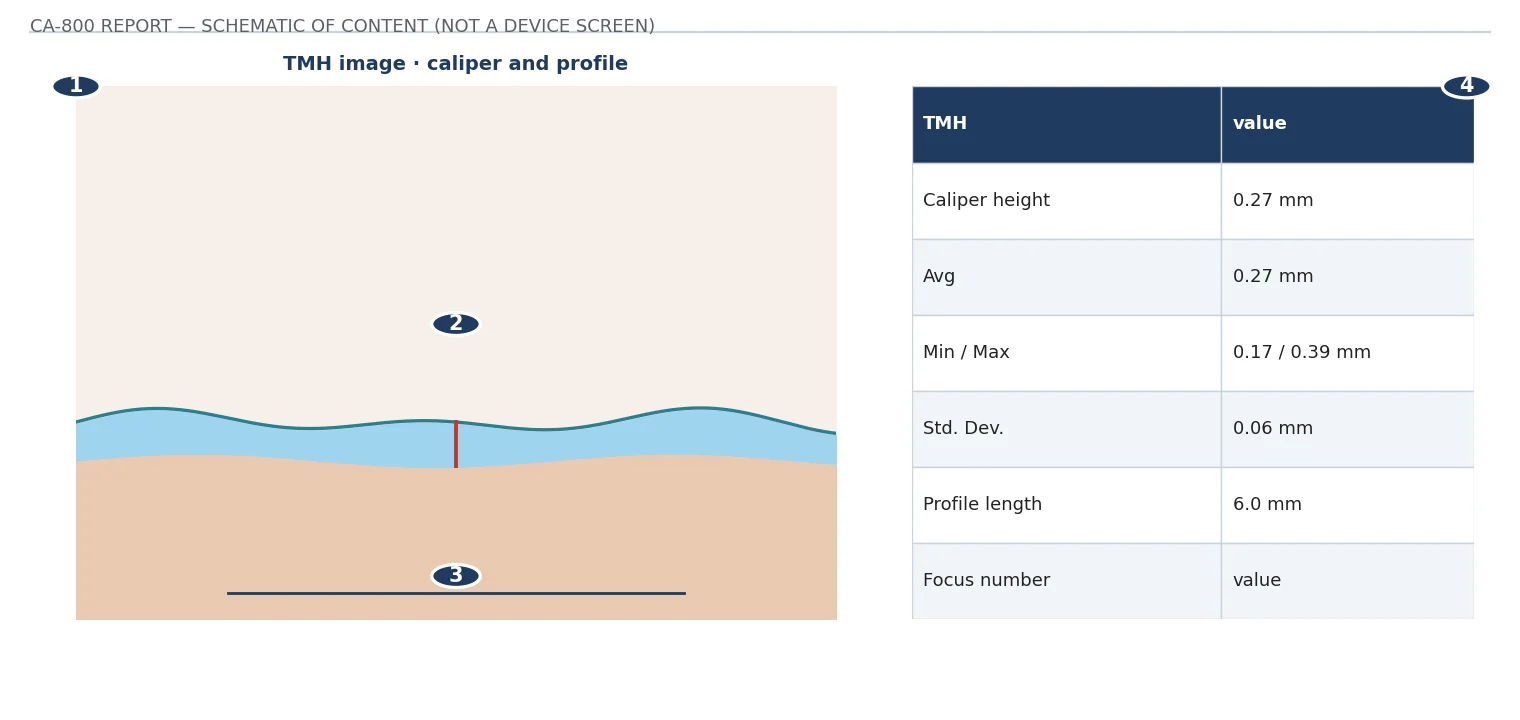
Schematic of the report’s documented content drawn from the manual’s field list; values are illustrative and the layout is not a reproduction of the device screen.
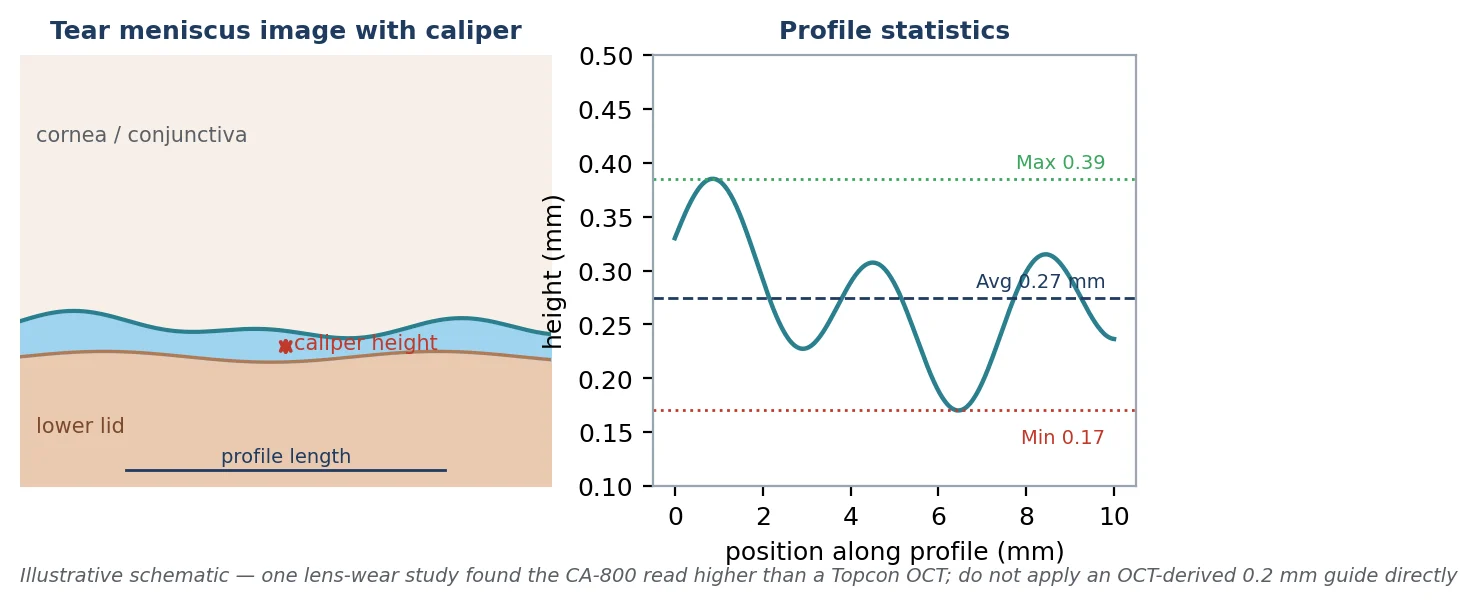
TMH estimates the height of the lower tear reservoir, providing context for aqueous tear volume. It is not a direct lacrimal secretion rate, a Schirmer measurement, or total tear volume. A normal reservoir can coexist with rapid evaporation or poor tear spreading.
| Parameter / unit | What it means and why it is used | Expected value / clinical interpretation |
|---|---|---|
| Caliper height, mm | Distance between selected lower and upper boundaries of the meniscus at one image position | About 0.2–0.3 mm is a commonly used orientation value. <0.2 mm can suggest a reduced reservoir, but is not a universal CA-800 diagnostic boundary |
| Caliper position / angle | Location and orientation of the measurement across the meniscus | No healthy numerical target. Measure consistently and avoid oblique placement, lid tissue or reflection edges |
| Min / Max, mm | Smallest and largest height along the analysed profile | A local minimum can be low despite an adequate central value; extremes are sensitive to boundary errors and the selected profile length |
| Avg, mm | Mean profile height across the selected region | Useful for repeated assessments with matching location and length. It is not identical to a single central caliper measurement |
| Std. Dev., mm | Variation of height along the profile | Greater variation can reflect an uneven meniscus, lid anatomy or tracing problems. No universal normal SD was verified |
| Profile length / control points | Extent of the analysed meniscus and manually anchored boundaries | Changing the sampled length changes the mean and extremes. Preserve comparable boundaries in follow-up |
| Focus number / enhancement | Acquisition focus indicator and contrast aid | The focus number is not tear quality. Enhancement helps visibility but does not create additional physical height information |
A repeatedly low meniscus with symptoms and corroborating findings supports investigation of aqueous deficiency. A high meniscus can reflect reflex tearing, recent drops, punctal occlusion or impaired drainage; it does not establish normal tear quality. Recent blinking and the time of photography influence the result.
Method matters. Published TMH measurements differ with viewing geometry and age; some otherwise healthy elderly eyes measure below 0.2 mm. In a study of 121 contact-lens wearers, CA-800 TMH repeatability was 0.07 mm with an intraclass correlation of 0.93, and in that contact-lens-wear study mean CA-800 TMH exceeded the Topcon 3D OCT-2000 measurement on the same eyes (0.22 ± 0.08 vs 0.17 ± 0.06 mm); the authors concluded the two methods might not be interchangeable. That is one comparison in one population against one OCT platform, not a universal bias. It is sufficient reason not to map a 0.2 mm orientation value derived from OCT literature directly onto a CA-800 caliper reading. Corroborate the finding rather than diagnosing aqueous deficiency from one image.
Sources: [1] §§13.9.2, 14.10; [9]; [21].
Figure 26 · The MEIB report
What the meibography report contains.
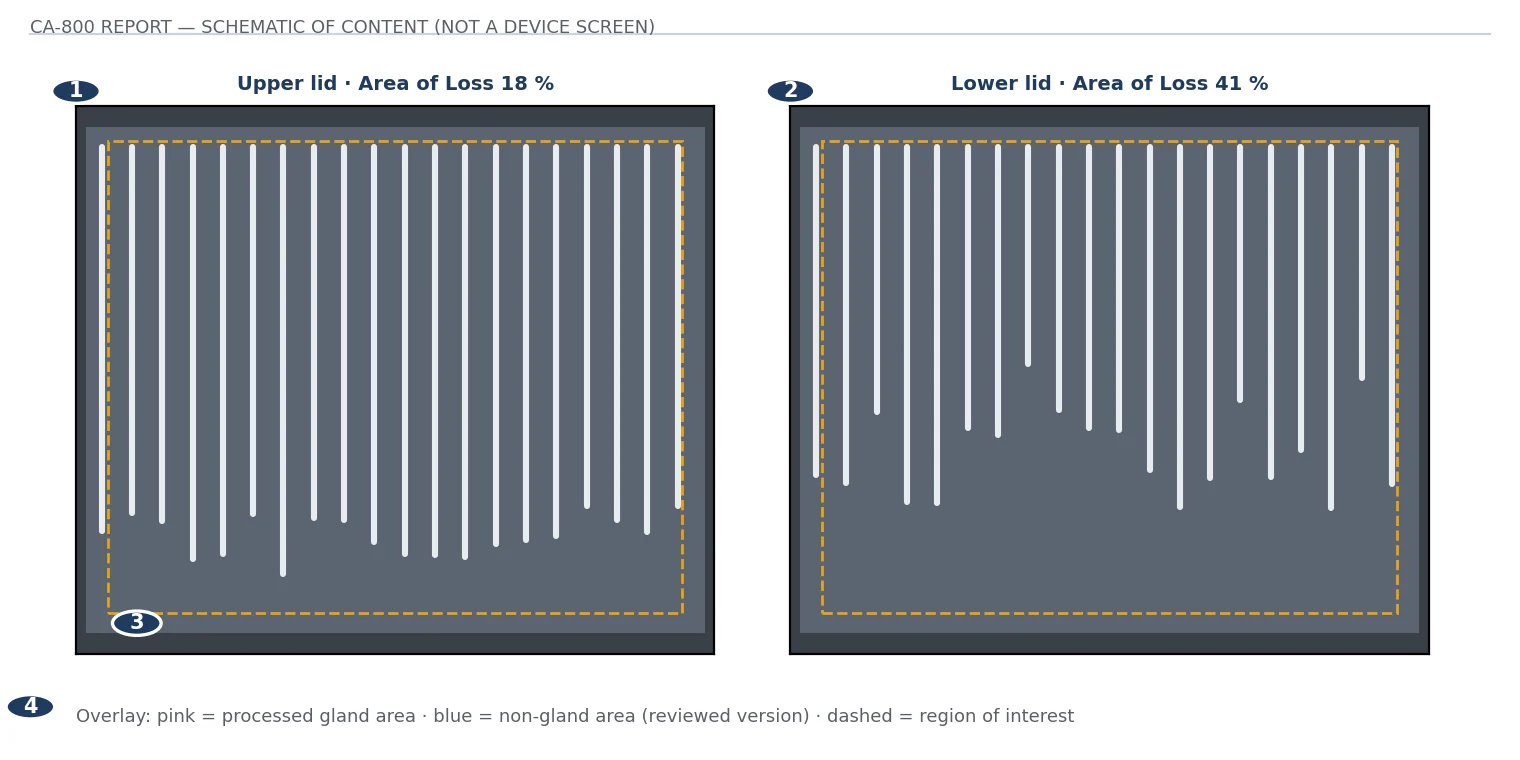
Schematic of the report’s documented content drawn from the manual’s field list; values are illustrative and the layout is not a reproduction of the device screen.
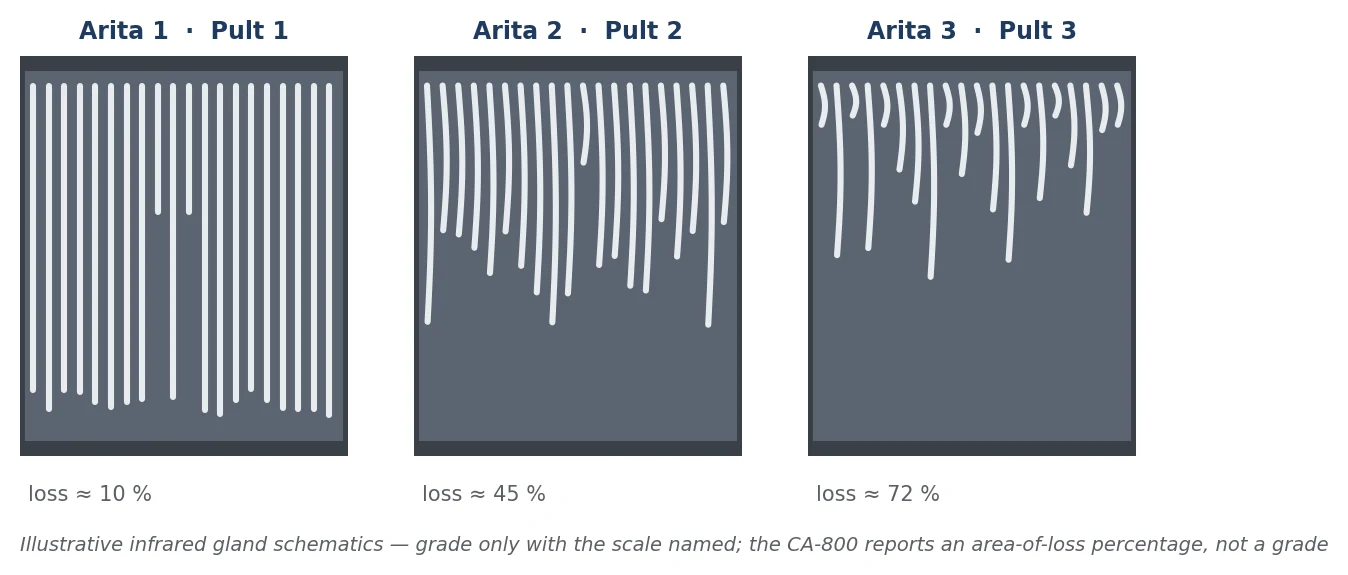
| Parameter / unit | What it means and why it is used | Expected value / clinical interpretation |
|---|---|---|
| Upper / lower lid | Infrared view of the everted tarsal plate and visible glands | Record each eyelid separately. Incomplete eversion can create false apparent loss |
| Area of Loss, % | Area without detected glands divided by the selected total region, multiplied by 100 | Lower loss generally indicates greater visible preservation. A single universal age-independent normal percentage is not established |
| Region of interest | Area manually selected for software analysis | Include comparable tarsal tissue each time; avoid counting hidden lid regions, reflections or non-gland tissue |
| Blue / pink overlay | In the reviewed version, blue is area not covered by glands; pink is processed area covered by glands | Inspect agreement with the raw image. Colour is segmentation output, not direct proof of permanent gland destruction |
| Morphology | Shortening, distortion, dilation, tortuosity and dropout, described by the clinician | No universal normal value for every shape. Visible structural loss supports MGD assessment but does not quantify secretory function |
| Enhancement | Contrast processing to improve visibility | Use a consistent processing setting across visits. Altered visibility can change apparent area loss without true anatomical change |
Two grading conventions are widely used in the literature, and a CA-800 percentage maps onto neither automatically.
| Scale | Grades | Interpretation |
|---|---|---|
| Arita meiboscore (2008), per lid | 0 no loss; 1 lost area less than one third; 2 one third to two thirds; 3 more than two thirds. Summed per eye 0–6 | Developed on 236 volunteers aged 4–98 with a non-contact infrared meibograph; score correlated with age (R = 0.428). A clinical grading convention, not a CA-800 output |
| Pult five-grade scale (2013), per lid | 0 no gland loss; 1 <25%; 2 26–50%; 3 51–75%; 4 >75% | The pictorial scale the Keratograph documentation refers to as the JENVIS grading scales; intra-observer agreement was better with computerised grading than with either subjective scale |
Grade 0 on either scale is the best-preserved category, not a requirement that every healthy adult shows absolutely zero loss. Do not replace the CA-800 percentage with an unlabelled grade, and do not pool upper and lower values without naming the method. Assess gland expressibility and secretion quality separately; those are not measured by the infrared image.
Sources: [1] §14.9; [17]; [34]; [47].
Figure 28 · The FLUO report
What the fluorescein record contains.
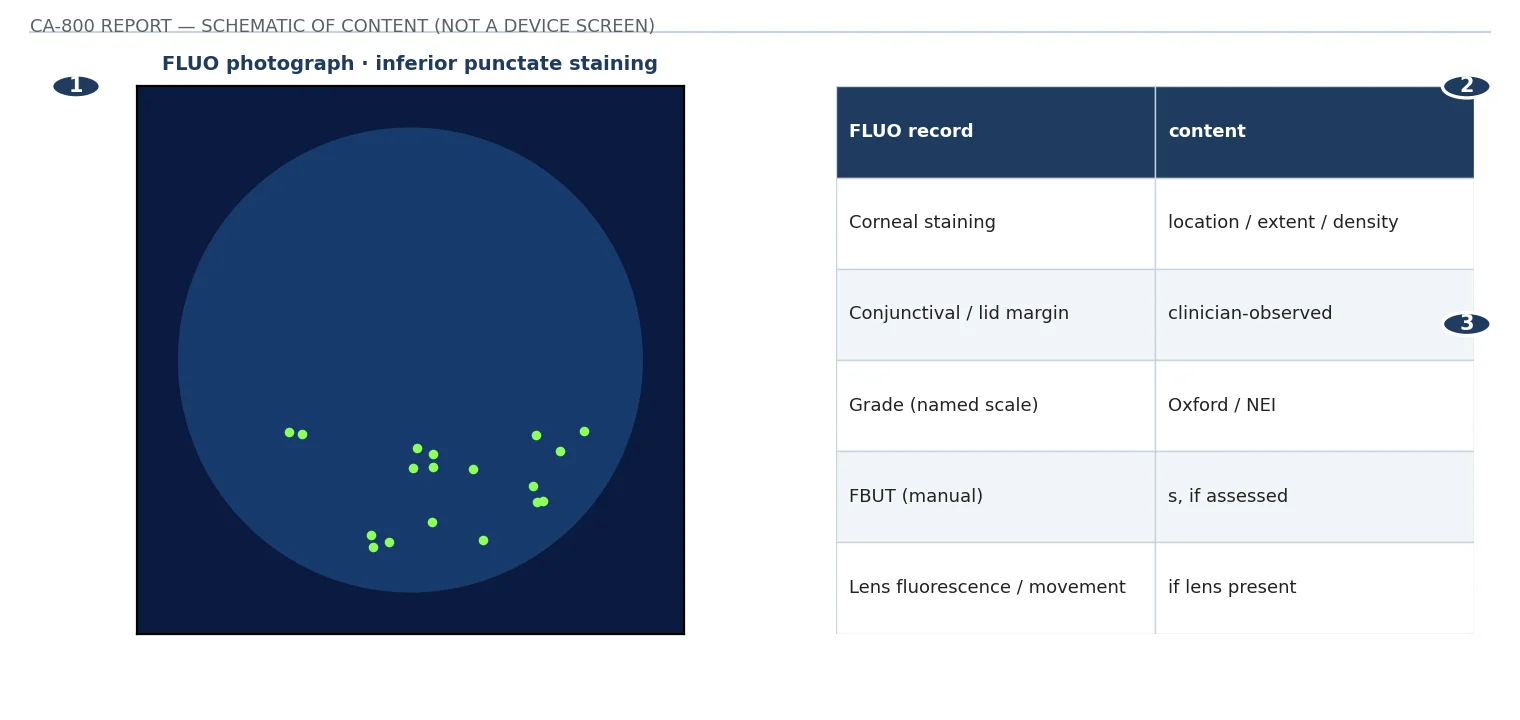
Schematic of the report’s documented content drawn from the manual’s field list; values are illustrative and the layout is not a reproduction of the device screen.
The FLUO report documents surface fluorescence and, when a lens is present, the observed fluorescein pattern and lens movement. The reviewed manual describes imaging rather than an automatic tear-production, staining-severity or permeability assay.
| Parameter / unit | What it means and why it is used | Expected value / clinical interpretation |
|---|---|---|
| Corneal staining | Location, extent, density, confluence and pattern of epithelial staining | Expected: absent or minimal staining in a healthy surface. Focal, confluent or persistent defects require cause-specific evaluation |
| Conjunctival / lid margin staining | Clinician-observed surface staining, with the dye and illumination stated | Fluorescein alone does not replace lissamine-green assessment. A photograph should not be assigned a score for tissue or dye it did not capture |
| Staining grade | A separately applied standardised scale, such as Oxford or NEI | Low/zero is favourable, but scales are not interchangeable. State the scheme, region, dye dose and observation time |
| FBUT / TBUT, s | If manually assessed, time from a blink to visible tear-film breakup after fluorescein | Historically a value <10 s was used as an instability clue. The TFOS DEWS III diagnostic summary pairs its NIBUT <10 s sign with a fluorescein breakup-time criterion at 5 s; confirm the exact wording in the full report before applying it. Volume and technique strongly affect the result. This is not the CA-800 non-invasive 5% calculation |
| Pooling / negative staining | Fluorescence collecting in depressions or reduced fluorescence over elevated/unwetted areas | Pooling is not necessarily epithelial damage. Negative staining can reveal an irregular surface and must be interpreted with slit-lamp findings |
| Lens fluorescence | Observed tear distribution beneath/around a lens and its wetting | An adequate pattern depends on lens design. A green zone does not have one universal safe clearance thickness |
| Lens movement / centration | Position and motion in the real-time recording | Assess during blinking and settling. It is observed on-eye behaviour, distinct from the Lenses module's geometric simulation |
Document where the staining occurs and the associated examination. Inferior exposure, diffuse punctate staining, a focal abrasion and contact-lens bearing can have different causes despite similar total stain scores. Severe pain, photophobia, an infiltrate or a persistent epithelial defect warrants prompt clinical assessment rather than interpretation as routine dry eye.
Sequence: acquire non-invasive tear and corneal measurements before instilling dye. Use the same staining method at follow-up so changes are interpretable. Note that the DEWS III staining criteria count punctate spots (>5 corneal, >9 conjunctival) rather than applying a named grading scale, and lid-margin staining is specified by length and width; a photograph graded on the Oxford scale cannot be converted to those counts after the fact.
Sources: [1] §§13.8, 14.7; [4]; [18].
Figure 29 · The Lenses module
What the fitting simulation contains.
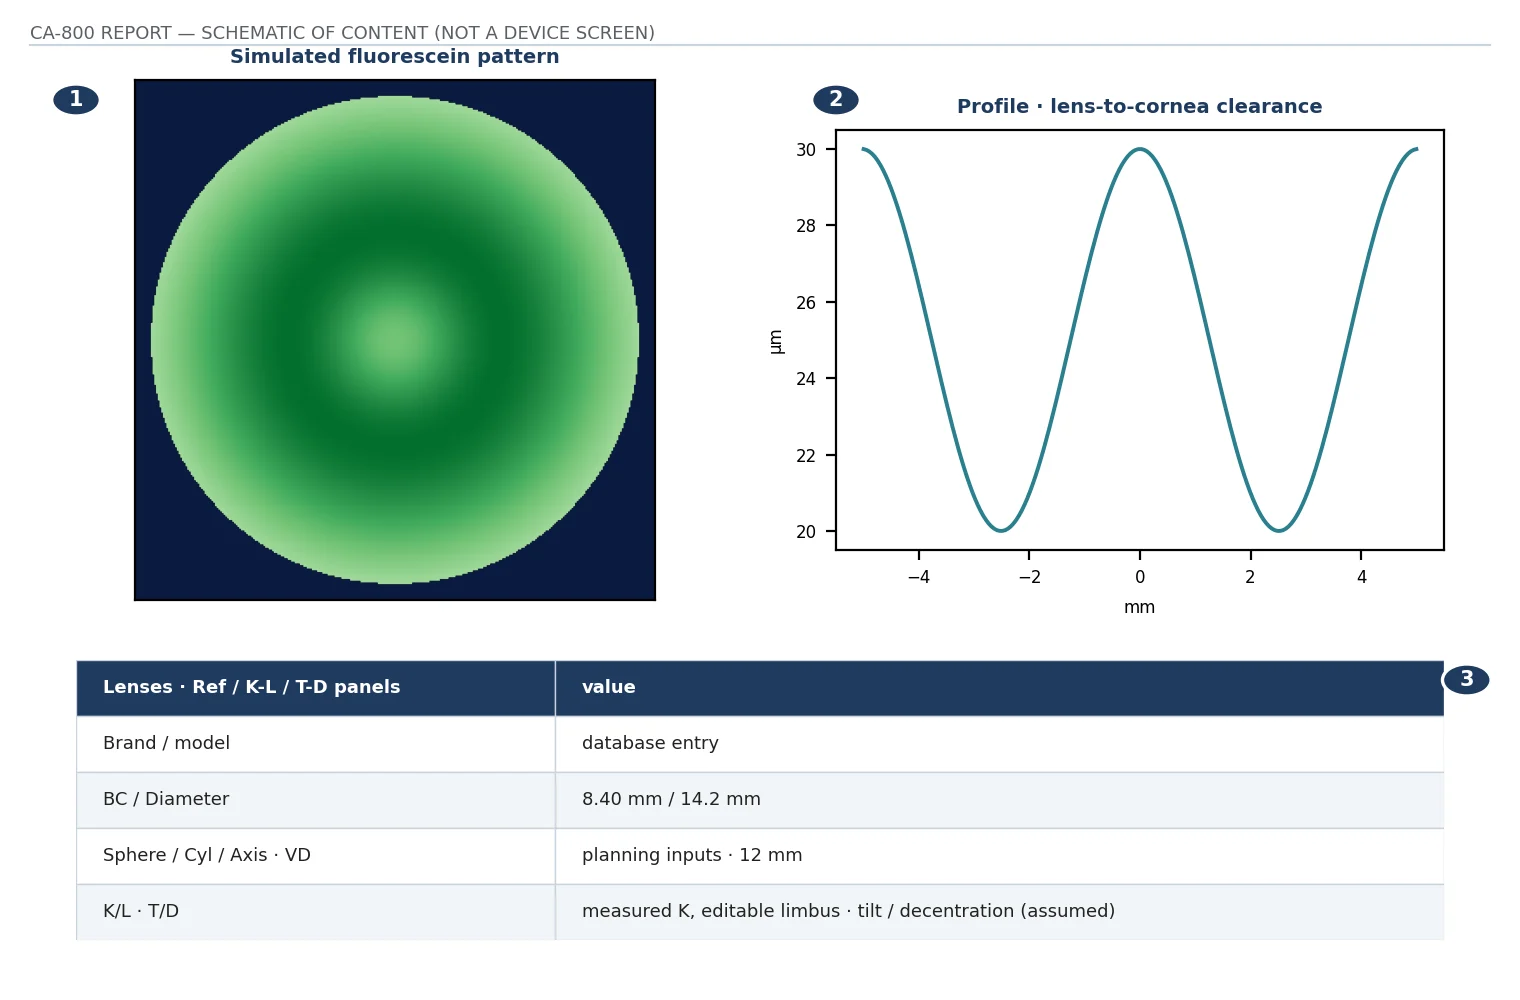
Schematic of the report’s documented content drawn from the manual’s field list; values are illustrative and the layout is not a reproduction of the device screen.
The Lenses module compares the reconstructed cornea with a selected lens design from its database. It can reduce the number of trial lenses, but it does not directly measure the fit of that lens on the living eye. The manufacturer explicitly distinguishes simulated geometry from actual wear.
| Parameter / unit | What it means and why it is used | Expected value / clinical interpretation |
|---|---|---|
| Brand / model | Selected lens design and manufacturer data | No normal value. Confirm the exact design and database version; models with the same base curve can have different geometry |
| Base curve / BC, mm or D | Radius or curvature of the lens's central posterior region | Patient- and design-specific. A smaller mm value is steeper. Central K alone cannot determine the final fit of a complex lens |
| Diameter, mm | Overall selected lens diameter | Depends on corneal size, lens purpose and design. It is not interchangeable with back optic zone diameter |
| Sphere / cylinder / axis | Refractive inputs or lens parameters in the Ref panel | These are entered or calculated planning values, not a CA-800 manifest refraction. Verify cylinder notation |
| VD, mm | Vertex distance used for refractive conversion | Use the measured clinical distance appropriate to the input refraction. It is not corneal clearance |
| K/L | Keratometric data and corneal diameter; limbus can be edited | Check measured geometry before relying on the proposed lens. Review the boundary if diameter appears implausible |
| T/D: tilt / decentration | User-adjustable simulated orientation and lens position | An assumed position, not observed on-eye centration. Changing it changes the predicted fluorescein pattern |
| Apical clearance / Profile | Assumed apical separation and a graph of lens-to-cornea distance along a chosen meridian | No universal target for all lens designs. Simulation does not measure settled scleral vault, tear exchange, bearing pressure or oxygen delivery |
Document the selected design and all modified assumptions. Then assess the physical trial lens, centration, movement, fluorescein distribution, comfort, over-refraction and tissue response. For scleral designs, assess central/limbal clearance and the landing zone with appropriate clinical methods; Placido coverage does not constitute complete corneoscleral profilometry.
Sources: [1] §§16.1, 17.7.
Figure 30 · The toric IOL module
Which fields are measured by the CA-800 and which are entered.
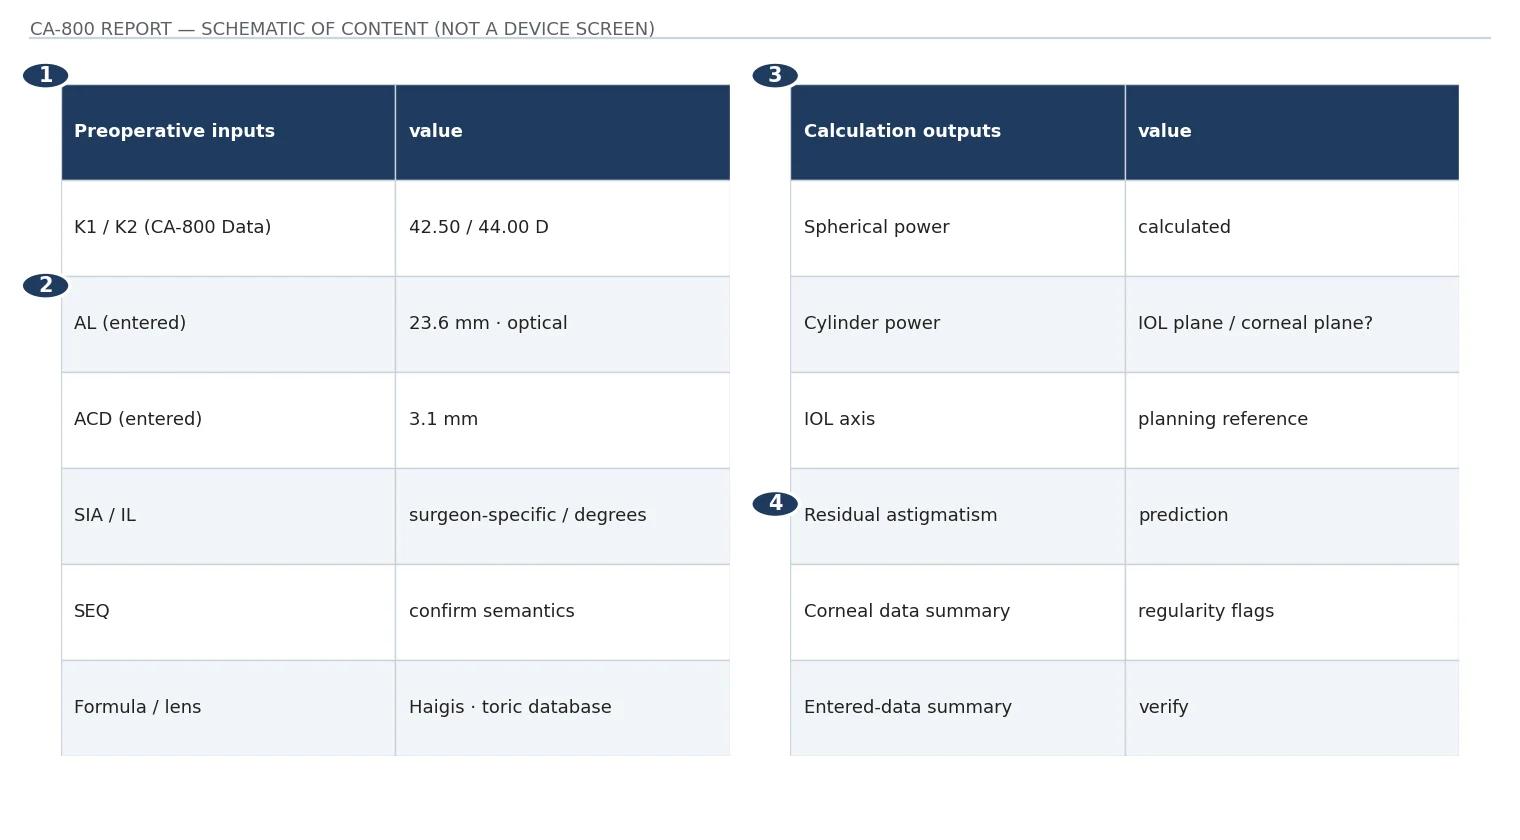
Schematic of the report’s documented content drawn from the manual’s field list; values are illustrative and the layout is not a reproduction of the device screen.
Measured versus entered. The CA-800 can supply anterior corneal K values. Axial length and anterior chamber depth in this module are external measurements entered by the operator; their presence in the report does not mean the CA-800 measured them.
| Parameter / unit | What it means and why it is used | Expected value / clinical interpretation |
|---|---|---|
| AL, mm | Axial length measured by a separate biometer; major input to IOL power estimation | Many adult eyes are around 23–24 mm, with wide physiological and refractive variation. This is context, not an exclusion criterion |
| ACD, mm | Anterior chamber depth from the external measurement method | Often around 3 mm in adults; definition may start at epithelium or endothelium. Match the definition expected by the formula and input field |
| Optical / acoustical | Method used to acquire external biometric data | Choose the actual modality. Method or transcription errors can change the calculation |
| K1 / K2 and cylinder | Keratometric inputs; the CA-800 Data function can populate measured K | Require reproducible measurements and a stable surface. Preserve axis convention and distinguish anterior-derived K from total corneal astigmatism |
| SIA, D; axis context | Surgically induced astigmatism assumption | Surgeon-, incision- and method-specific. There is no single normal number to enter for all surgeons |
| IL, degrees | Planned incision location | A surgical input, not a measured ocular abnormality. Must correspond to the surgeon's intended meridian |
| SEQ, D | Spherical-equivalent field in the preoperative planning panel | The manual lists the field without fully defining its target semantics; confirm the installed workflow before treating it as target refraction or entering manifest SE |
| Formula / lens model | Rev. 18 lists Haigis, Hoffer Q, SRK II, SRK/T and Holladay I, plus a selectable toric lens database | No normal formula or implant. Validate available lens constants, model and formula with the surgeon's current planning workflow |
Population biometric values explain what a number represents; they do not justify replacing a missing patient-specific measurement. Do not insert an "average" AL, ACD, SIA or target into a surgical calculation.
| Parameter / unit | What it means and why it is used | Expected value / clinical interpretation |
|---|---|---|
| Spherical power, D | Calculated IOL spherical power for the chosen model and input set | No normal range or universal target. It depends on the eye, intended refraction, constants and formula |
| Cylinder power, D | Proposed toric component for the selected implant | Check whether values refer to the IOL plane or an equivalent corneal plane. They are not directly interchangeable |
| IOL axis, degrees | Proposed alignment orientation from the planning calculation | Must be interpreted with the chosen implant and surgical reference system; it is not automatically the corneal steep-axis label |
| Residual astigmatism, D; axis if displayed | Predicted cylinder remaining with the chosen implant and alignment | A small residual may be desired, but this is a prediction, not a guarantee of postoperative refraction or visual quality |
| Summary of corneal data | Astigmatism, irregularity, asymmetry, keratometry and keratoconus panels | These identify whether anterior corneal data appear reliable and regular enough to inform planning; they do not establish overall surgical suitability |
| Entered-data summary | AL, ACD, measurement modality and surgical assumptions carried into the calculation | Independently verify these against the originating reports and intended eye before clinical use |
Posterior cornea matters. Anterior-only astigmatism does not necessarily equal total corneal astigmatism. Posterior curvature can change the magnitude and orientation relevant to toric correction. The reviewed CA-800 manual does not establish direct measurement of posterior corneal curvature, nor verify a contemporary posterior-corneal correction for every installed toric calculation. Confirm the actual implementation with the surgeon and manufacturer.
Use a surgical workflow, not a standalone printout. The operating surgeon should reconcile the calculation with current biometry, posterior-corneal treatment, ocular-surface stability, lens constants and surgical planning. Prior corneal refractive surgery, ectasia and markedly irregular corneas require special attention because standard anterior K assumptions may fail.
Clinical significance. The report is decision support based on explicit inputs and assumptions. A precise-looking output can be wrong when the input K, eye, axis, biometric definition or lens model is wrong.
Sources: [1] §16.2; [5] for adult biometry context; [19].
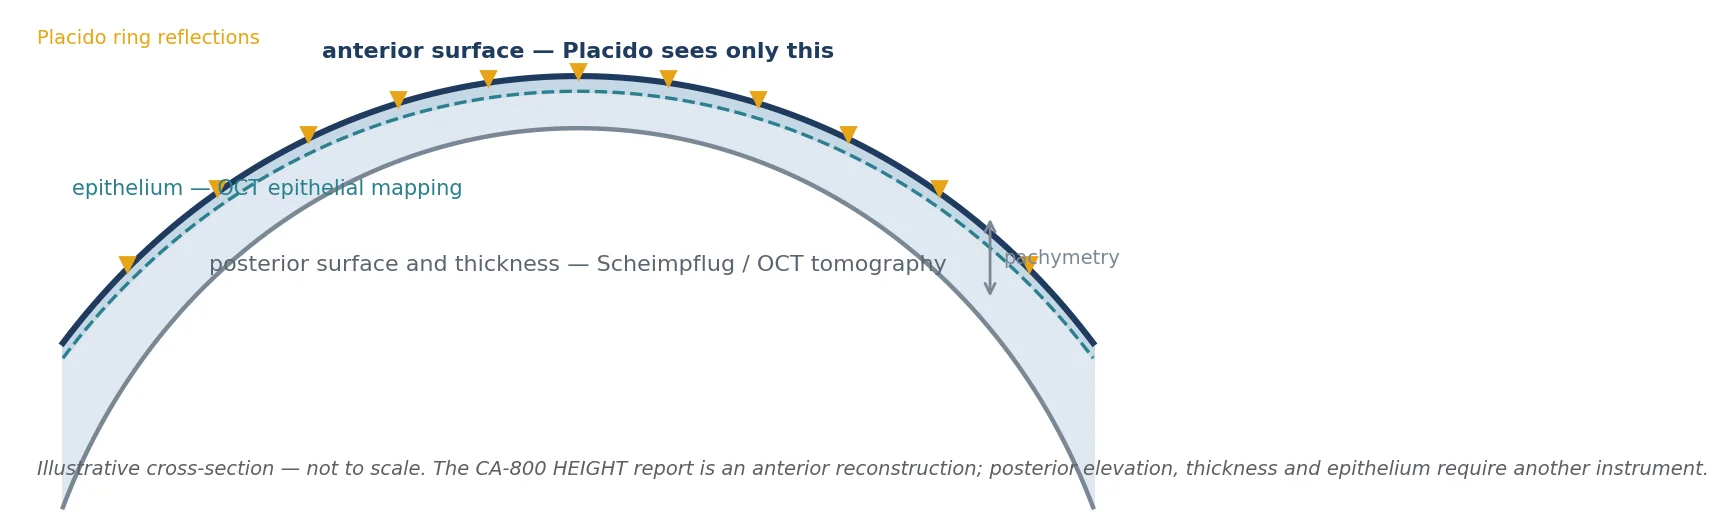
The CA-800 is a Placido reflection topographer with ocular-surface and pupil modules. The clinical questions it cannot answer on its own — posterior corneal shape, thickness distribution, epithelial thickness, corneal biomechanics — are exactly the ones other instrument classes were built for. This section describes what each class measures so that the reader knows which examination to request next, and why a number from one of them cannot be pasted into a CA-800 context.
| Class | Principle | What it measures that the CA-800 does not | Representative instruments (manufacturer-stated features) |
|---|---|---|---|
| Placido topography | Reflection of illuminated rings from the tear-coated anterior surface | Nothing additional; same class as the CA-800, with different ring counts, coverage and algorithms | CA-800: 24 rings, 6,200 measured points, coverage to 9.8 mm. Keratograph 5M: 22 rings, 22,000 evaluated points. ATLAS 500: 24 rings, 6,144 points, 9.3 mm coverage. Medmont E300: 32 rings, 9,600 points, coverage 0.25–11 mm |
| Scheimpflug tomography | Rotating slit camera images optical sections of the cornea rather than reflections from the tear film; this does not make it immune to surface-related measurement error | Posterior surface, pachymetry map, elevation of both surfaces, anterior chamber | Pentacam: rotating Scheimpflug, 50 images in two seconds |
| Scheimpflug plus Placido hybrid | Combines both principles in one capture | Both surfaces plus Placido anterior detail | Sirius: 25 Scheimpflug meridians plus one Placido image; anterior surface 35,632 points, posterior 30,000 points, 12 mm diameter. TMS-5: Placido (25 or 31 rings, up to 6,400 or 7,300 points) plus Scheimpflug slit-scan. Galilei G6: dual Scheimpflug plus Placido, aligned to the first Purkinje reflex |
| Anterior-segment OCT plus Placido | Optical coherence tomography cross-sections plus Placido reflection | Both surfaces, pachymetry, and epithelial thickness mapping; 16 mm section width | MS-39: SD-OCT with Placido; axial resolution of approximately 3–5 µm reported in the literature; pupil and tear-film analysis |
| Very-high-frequency ultrasound | Acoustic sectioning | Epithelial and stromal thickness independent of optical clarity | Artemis (research and specialist use) |
Sources: [20]; [25]; [37]; [39]; [40]; [41]; [42]; [43]; [44]; [45].
| Index | Instrument and origin | What it is | Threshold as published, and where it applies |
|---|---|---|---|
| KPI (CA-800) | CA-800 KC/AK tab | Keratoconus probability index combined with AK, AGC and SI, shown as a green/yellow/red class | Numerical class boundaries are not documented in the reviewed manual. Use the class the software displays |
| KPI (Klyce/Maeda) | Tomey TMS series, 1994 | A linear discriminant function of eight TMS indices (Sim K1, Sim K2, UPS, DSI, OSI, CSI, IAI, AA) developed on TMS-1 data; validation sensitivity 89%, specificity 99% | A value above 0.23 is described in the secondary literature as suggestive of keratoconus, on the TMS. Not a CA-800 value despite the shared abbreviation |
| KISA% | Rabinowitz and Rasheed, 1999; videokeratography | Product of four terms × 100 / 300: an adjusted K (central K below 47.2 D is replaced by 1, above 47.2 D by K − 47.2), the I−S value, the astigmatism term and the skewed radial axis term, each taken as an absolute value with any component below 1 set to 1 | At a cutoff of 100, 280 of 281 participants were correctly classified; a range of 60–100 was proposed for suspects. Developed on a specific videokeratoscope and its I-S sampling; not implemented on the CA-800 |
| I-S value | Rabinowitz and McDonnell, 1989 | Difference between average inferior and superior power at defined points 3 mm from centre | The commonly quoted 1.4 D threshold is attributed to that work in secondary sources; its exact primary wording was not verified for this edition. The CA-800 SI uses its own sampling regions and is not the same calculation |
| Central K >47 D | Rabinowitz-era videokeratography criteria | A single-value flag for steep central cornea | A population heuristic from a different device. Ordinary central K on a CA-800 neither confirms nor excludes ectasia |
| SRI / SAI | TMS series | SRI: power-gradient differences across 256 semi-meridians; SAI: power differences between points 180° apart across 128 meridians | SRI below about 0.56 described as normal, on the TMS. The CA-800 SAI is a different 4.5 mm asymmetry statistic in dioptres |
| PathFinder II | ZEISS ATLAS 9000 | Software analysing 12 anterior corneal parameters against a clinical database, classifying normal, abnormal or pathological, with keratoconus, suspect and pellucid patterns | ATLAS-specific classification; the 12 parameters were not verifiable from manufacturer documentation for this edition |
| BAD-D | OCULUS Pentacam, Belin/Ambrósio Enhanced Ectasia Display | Regression-derived combined deviation from normal using anterior and posterior elevation, thickness progression and other tomographic parameters, expressed in standard deviations | Manufacturer guide: white <1.6 SD within normal limits, yellow ≥1.6 suspicious, red ≥2.6 abnormal. Published algorithm analyses report empirically optimal cutoffs of roughly 1.8–1.9 for BAD-D v3 and v4 in distinguishing normal from clinical ectasia. Requires posterior data the CA-800 does not have |
| Belin/Ambrósio elevation-difference limits | Pentacam | Change in elevation between the standard best-fit-sphere map (8.0 mm) and the enhanced-reference map that excludes the thinnest zone | Manufacturer guide: anterior <5 / 5–7 / >7 µm; posterior <12 / 12–16 / >16 µm (green / yellow / red). A difference between two Pentacam reference surfaces, not raw elevation; no CA-800 equivalent exists |
| ABCD staging | Belin and Duncan, 2016; Pentacam display | A: anterior radius over the 3 mm zone centred on the thinnest point; B: posterior radius over the same zone; C: thinnest pachymetry; D: distance corrected visual acuity | Normative data from 672 eyes (ARC 7.65 ± 0.236 mm, PRC 6.26 ± 0.214 mm, thinnest pachymetry 534.2 ± 30.36 µm). Three of the four components need tomography |
| Kmax | Pentacam and others | Location of maximum sagittal (axial) power on the front surface | A reading of the axial map's steepest point. The CA-800 AK is apical curvature, which is not automatically the same point or value |
| NIKBUT first / average | Keratograph 5M | First-break time anywhere on the cornea, and an average across the analysed area | Not the CA-800 5% Level TBT. See the tear breakup section |
| Meibo-Scan / JENVIS grading | Keratograph 5M | Infrared meibography graded on a pictorial five-grade scale | A grading convention applied by the clinician; not the CA-800 area-of-loss percentage |
The pattern across every row is the same. Each index is a function of a particular instrument's sampling geometry, reconstruction algorithm and development dataset. The abbreviation is portable; the threshold is not.
Sources: [1] §14.1.4; [25]; [26]; [27]; [28]; [29]; [30]; [31]; [39]; [46]; [48].
Very-high-frequency ultrasound work described an epithelial "doughnut" pattern in keratoconus — localised central thinning surrounded by an annulus of thick epithelium — and proposed it as an aid to early diagnosis. The first Fourier-domain OCT epithelial mapping study reported normal central, superior and inferior epithelial thickness of 52.3 ± 3.6, 49.6 ± 3.5 and 51.2 ± 3.4 µm respectively, with a pattern-standard-deviation cutoff of 0.057 giving complete separation of normal from keratoconic eyes in that sample, and zonal repeatability of 0.7–1.9 µm. Subsequent work comparing three OCT platforms found epithelial thickness readings were not interchangeable between devices, with one platform reading thicker than another by about 4 µm. The relevance for the CA-800 reader is twofold: epithelial remodelling can mask or mimic an anterior-surface finding on Placido, and a Placido-suspicious cornea with a normal epithelial map on OCT is a different clinical proposition from one with a doughnut pattern.
Sources: [36]; [37]; plus the VHF ultrasound literature cited in [37]'s bibliography.
These are invented teaching examples. They demonstrate reasoning, not device-validated thresholds, diagnoses or treatment recommendations. Each follows the same four-question sequence: is the acquisition valid; what does the parameter actually describe; is the comparison like-for-like; what other examination would confirm or challenge the explanation?
Findings: Kflat 42.50 D, Ksteep 44.00 D; symmetric bow tie; repeatable axis; low irregularity and green KC classification. Interpretation: 1.50 D of regular anterior corneal astigmatism with no suspicious pattern on these scans. Next question: Does manifest refraction and acuity explain the complaint? If surgery is contemplated, a green topography alone does not replace the rest of the preoperative assessment.
Findings: TBT5% 4.0 s, mean IBI 8.0 s, OPI 0.50; TMH 0.27 mm; visible gland loss and reduced gland expressibility on separate examination. Interpretation: The tear surface becomes unstable before the average next blink, despite a reasonably sized reservoir. Next question: Evaluate evaporative contributors, blink completeness, inflammation and symptoms; TMH alone cannot exclude dry eye or identify its mechanism.
Findings: Inferotemporal steepening, increased coma and yellow KC class on a poor tear surface. Interpretation: Ectasia is a possibility, but the poor surface can alter shape indices. Next step: Obtain reproducible quality measurements, review contact-lens history and add tomography and pachymetry when appropriate. If the pattern persists, do not dismiss it because central K falls within an ordinary range.
Findings: HOA RMS is lower at follow-up, but baseline was analysed at 6 mm and follow-up at 3 mm. Meibography loss also appears lower, with a smaller selected region. Interpretation: Neither observation establishes anatomical or optical recovery. Next step: Reanalyse with matched apertures, coverage and gland regions, and examine concordance with symptoms and independently measured vision.
Findings: A referral letter reports NIKBUT "first" of 5.8 s on a Keratograph 5M. The CA-800 today shows 5% Level TBT 9.5 s, Δ 5% Level TBT 10.2 s across three acquisitions, with the earliest coloured sectors on the sector map at roughly 4 s. Interpretation: The two instruments have not disagreed. The Keratograph number is a first-break endpoint; the CA-800 summary is a proportional endpoint. The sector map shows evidence of early focal instability, but a sector value on a summary map may be an average across acquisitions and is not a validated first-break measurement. Next step: Record both values with their endpoints named. Do not chart "NIBUT improved from 5.8 to 10.2 s". If the DEWS III NIBUT sign is being assessed, the Keratograph first-break value meets it on that instrument; the CA-800 result should be described as supportive evidence of early breakup unless the acquisition, endpoint and method are confirmed.
Findings: A 24-year-old with a sibling treated for keratoconus requests laser refractive surgery. CA-800: green KC class, KPI low, SI near zero, regular bow tie, cylinder 1.25 D, Q −0.28 at 8 mm, good repeatability across three captures. Interpretation: The anterior surface is regular on this instrument today. That statement is accurate and it is not the answer to the question being asked, because the CA-800 has no posterior-surface, thickness-distribution or epithelial data, and the consensus literature places weight on precisely those for subclinical disease. Next step: Tomography with posterior elevation and pachymetric progression, and epithelial mapping where available, before any surgical decision. Document that the Placido screen was unremarkable and that it was not the basis for clearance.
Reasoning sequence: Is the acquisition valid? What structure or function does the parameter actually describe? Is the comparison like-for-like? What other examination would confirm or challenge the proposed explanation?
Sources: teaching synthesis from [1], [4], [12–19], [24], [25], [32].
| Record | Minimum useful content |
|---|---|
| Context | Eye; indication; software/hardware; prior surgery; lens type and time since removal; recent drops; testing conditions |
| Quality | Calibration status; acceptable repeats; ring coverage; fixation; surface artefacts; exclusions and manual edits |
| Corneal shape | Map type/scale; Kflat/Ksteep and axes; cylinder; sampling zones; irregularity/asymmetry; KC/CLMI class and notable values |
| Optical / pupil data | Wavefront aperture and term set; dominant aberration; pupil lighting protocol, diameter and reference for decentration |
| Ocular surface | Exact TBT endpoint; individual values and summary; duration/censoring; IBI/OPI; TMH sampling; gland loss by eyelid and region; staining method |
| Clinical interpretation | Pattern, concordance with symptoms/acuity/examination, alternatives, limitations and next evaluation or follow-up interval |
"CA-800 examination of [eye], [software version], obtained for [indication]. Quality [adequate/limited] because [reason]; [number] acceptable repeats. [Axial/tangential] maps at [scale/zone] show [pattern]. Kflat [ ] D at [ ]°, Ksteep [ ] D at [ ]°; cylinder [ ] D. KC classification [ ]; relevant indices [ ]. TBT endpoint [5% level / first sector] with results [ ] s and duration [ ]; IBI [ ] s, OPI [ ]. TMH [method/value], MEIB [lid/ROI/loss], FLUO [dye/scale/pattern]. Compared with [date] using matched settings, [change/no clear change]. Clinical correlation: [ ]. Plan: [ ]."
Define the endpoint before reviewing the follow-up. Repeat under comparable conditions and report both the numerical change and relevant patient function. A before/after improvement is an observation; demonstrating that a particular treatment caused it requires an appropriate study design and control of confounders. Small changes in gland segmentation, TBT or one topographic point need repeatability context — for CA-800 NIBUT measured through a soft lens, published repeatability was on the order of 4–7 s, which is larger than many "improvements" reported in practice; no lens-off repeatability figure has been published.
Sources: [1]; [4]; [10]; [13–18]; [22].
| Parameter | Reference / expected direction | Essential qualification |
|---|---|---|
| Central K | Often about 43–44 D; broad orientation roughly 40–46 D | Population context only. No single K value establishes or excludes ectasia |
| Regular corneal cylinder | 0 D means no principal-meridian difference; non-zero regular cylinder is common | No universal disease cutoff. Pattern, stability and visual consequence matter |
| Anterior Q | Often approximately −0.2 to −0.3 centrally | Diameter-, population- and instrument-dependent. Not a universal 8 mm CA-800 interval |
| WTW | Many adult eyes around 11–12.5 mm | Visible diameter only; not internal sulcus diameter |
| Pupil size | Photopic ~2–4 mm; mesopic ~3–6 mm; scotopic ~4–8 mm | Broad overlapping orientation ranges; age, lighting and medication matter |
| First-break NIBUT | <10 s is a TFOS DEWS III diagnostic sign with a positive OSDI-6 (≥4) | A sign, not an independent diagnosis. Do not substitute CA-800 5% TBT for this endpoint |
| CA-800 5% TBT | No universal validated numerical normal boundary identified | Longer tends to reflect greater stability; record raw movie, repeats and observation duration. Published repeatability ~4–7 s, measured through a soft lens; no lens-off figure |
| OPI | <1 means the chosen TBT endpoint precedes mean IBI | ≥1 does not exclude focal early breakup, especially with a 5% numerator |
| TMH | About 0.2–0.3 mm often used as a guide; <0.2 mm raises concern for low reservoir | Age, site, viewing geometry and recent drops affect the result. In one lens-wear study the CA-800 read higher than a Topcon 3D OCT-2000 |
| Blink rate | Often roughly 10–20/min in quiet awake conditions | Task-dependent; rate does not describe completeness |
| Meibography / staining | Minimal structural loss and absent/minimal staining are favourable | Use age context, gland function and a named dropout or staining scale |
| Anterior corneal HOA RMS | ~0.48 ± 0.12 µm at 6 mm on one Placido device in 228 eyes | Aperture-, device- and term-set-dependent. Orientation only |
| KPI/CLMI, SAI, SI, AGC, SD, RMS, elevation | No transferable universal numerical cutoff verified for the CA-800 implementations reviewed | Use the software class where provided, repeated morphology, stated analysis settings and clinical correlation |
Sources: [1], [4–12], [17–18], [21–22], [35]. These are reference aids, not a single manufacturer normative database.
A checklist to run before a report changes a decision. Each item names the error, the section that explains it, and the correction.
Each entry gives the report where the parameter appears and the section of this guide that explains it.
| Parameter | Report | Section |
|---|---|---|
| ACD | Toric IOL | Toric IOL module |
| AGC | KC/AK tab | Keratoconus screening indices |
| AK | KC/AK tab | Keratoconus screening indices |
| AL | Toric IOL | Toric IOL module |
| APP / Pupil Avg | I tab; P tab | Keratorefractive indices; WTW and P tab |
| Area of Loss % | MEIB | Meibography |
| Asphericity (Q, e, p, SF) | I tab; asphericity panel | Asphericity |
| Asymmetry (A) | I tab | Keratorefractive indices |
| Astigmatism at 3 / 5 mm | I tab | Keratorefractive indices |
| Axial map | MAP | Reading the corneal map |
| Base curve (BC) | Lenses | Contact lens fitting simulation |
| Best Fit Diameter | HEIGHT | Height and elevation |
| Blink/min; #Total Blink | Blink | Blinking and OPI |
| Broken sectors % | TBT | Tear breakup fields |
| Coma | ZER | Zernike; Optical quality |
| Cone area (A), diameter (D), RND | KC/CLMI | CLMI |
| Curvature Irreg. SD | I tab | Keratorefractive indices |
| Cylinder / axis | K tab | Keratometry |
| DIFF / COMP | Comparison | Comparison and progression |
| DSI | CLMI | CLMI |
| Duration; > Duration | TBT; Blink | Tear breakup fields; Blinking |
| FBUT / TBUT | FLUO (manual) | Fluorescein |
| Height / elevation | HEIGHT | Height and elevation |
| High Order map | ZER | Optical quality |
| IBI Average / SD | Blink | Blinking and OPI |
| IL | Toric IOL | Toric IOL module |
| K1 / K2 / Km / Sim-K | K tab | Keratometry |
| KPI / Kpi; green/yellow/red class | KC/AK tab | Keratoconus screening indices |
| La / Lt; Ma / Mt | CLMI | CLMI |
| LSA | I tab; ZER | Keratorefractive indices; Optical quality |
| OPD map / total RMS | ZER | Optical quality |
| OPI | Blink | Blinking and OPI |
| Photopic / mesopic / scotopic diameter | PUP | Pupillometry |
| PPK | CLMI | CLMI |
| PSF / spot diagram | ZER | Optical quality |
| Pupil centre x/y; Pupil-centre SD; Pupil Dec. | PUP; P tab | Pupillometry; WTW and P tab |
| R0 / Ro; R10–R30 | Asphericity panel | Asphericity |
| Radius Flat / Toricity / Asphericity (reference) | HEIGHT | Height and elevation |
| SAI | I tab | Keratorefractive indices; cross-device section |
| Sector time map | TBT | Tear breakup fields |
| SEQ | Toric IOL | Toric IOL module |
| SI | KC/AK tab | Keratoconus screening indices |
| SIA | Toric IOL | Toric IOL module |
| Surface SD | Asphericity panel | Asphericity |
| Tangential map | MAP | Reading the corneal map |
| TBT 5% Level; Δ 5% Level | TBT Summary | Tear breakup |
| TMH caliper / Avg / Min / Max / SD | TMH | Tear meniscus height |
| VD | Lenses | Contact lens fitting simulation |
| Visus / low-contrast simulation | ZER | Optical quality |
| WTW; WTW x/y offset | Screenshot / P tab | WTW and P tab |
| Zernike coefficient; analysis pupil | ZER | Zernike |
| Abbreviation | Meaning |
|---|---|
| AK / AGC | Apical curvature / apical gradient of curvature |
| APP / LSA | Average pupil-area corneal power / longitudinal spherical aberration |
| BAD-D | Belin/Ambrósio Enhanced Ectasia Display final deviation value (Pentacam) |
| K / KC / KPI | Keratometry; KC can mean keratoconus or central keratometry depending on the panel; KPI is a screening probability index (CA-800) or the Klyce/Maeda index (TMS) |
| KISA% | Rabinowitz videokeratography keratoconus index |
| SI / SAI / SD | Inferior–superior sampling difference / surface asymmetry index / standard deviation or residual irregularity, depending on context |
| SRI | Surface regularity index (TMS) |
| CLMI / DSI / PPK | Cone Location and Magnitude Index / Differential Sector Index / Percent Probability Keratoconus |
| OPD / RMS / HOA | Optical path difference / root mean square / higher-order aberrations; check the terms included in the software group |
| TBT / NIBUT / NIKBUT / FBUT | Tear breakup time / non-invasive breakup time / non-invasive Keratograph breakup time / fluorescein breakup time; endpoints are not necessarily equivalent |
| IBI / OPI / TMH | Interblink interval / Ocular Protection Index / tear meniscus height |
| MEIB / ROI / WTW | Meibography / region of interest / white-to-white visible corneal diameter |
| AL / ACD / SIA / IL | Axial length / anterior chamber depth / surgically induced astigmatism / incision location |
| BC / VD / SEQ | Base curve / vertex distance / spherical-equivalent field; confirm its planning role in the installed module |
| OSDI-6 | Six-item Ocular Surface Disease Index used for DEWS III screening |
Direct posterior corneal elevation; central or thinnest pachymetry; epithelial thickness; endothelial cell count; IOP or corneal biomechanics; direct total ocular aberrometry; axial-length acquisition; retinal/OCT structure; automated gland expressibility or secretion quality; tear osmolarity; MMP-9; lipid-layer thickness. These require other examinations or instruments unless a separate external result is explicitly supplied.
Units: 1 mm = 1,000 µm. For conventional keratometric index n = 1.3375, K(D) = 337.5 / r(mm). Thus r = 8.00 mm corresponds to 42.19 D. This equivalent keratometric power is not a direct measurement of both corneal surfaces.
Sources: [1–2].
The register lists the numerical claims and thresholds in this guide, where each comes from, and how much weight it can carry. It is the document a clinical reviewer should check first.
| Claim | Source | Status |
|---|---|---|
| CA-800: 24 rings, 6,200 measured points, >100,000 analysed, coverage to 9.8 mm | Manufacturer product page [20] | Manufacturer-stated; not independently measured |
| CA-800 5% Level TBT definition; Δ 5% is an average of included acquisitions | Manual [1] §14.11 | Device-defined |
| Automatic restart on a second blink within 5 s; 30 s maximum acquisition; blink recording maximum 5 min | Manual [1] §§13.9.3–13.9.4 | Device-defined |
| Pupillometry phase settings 500–5,000 ms | Manual [1] §14.6 | Device-defined |
| Toric module formulas: Haigis, Hoffer Q, SRK II, SRK/T, Holladay I | Manual [1] §16.2 | Device-defined |
| KPI green/yellow/red numerical boundaries | Not documented in reviewed manual | No validated cutoff |
| NIBUT <10 s; OSDI-6 ≥4; osmolarity ≥308 or interocular >8 mOsm/L; staining >5 corneal / >9 conjunctival spots / lid margin ≥2 mm and ≥25% | TFOS DEWS III abstract [4] | Clinical reference (consensus). Endpoint equivalence to CA-800 5% not established |
| CA-800 NIBUT repeatability 5.4 s, ICC 58.6%; median 3.3 vs 8.1 s subjective | Valencia-Nieto 2024 [15]; correction [16] content unverified | Clinical reference; pre-lens tear film with soft lenses in situ; not a lens-off figure; provisional until the correction is checked |
| CA-800 NIBUT vs OSDI r = −0.11 | Potenza 2026 [22] | Clinical reference |
| CA-800 mean BUT 3.18 ± 2.0 s in 44 students | Uzun 2022 [23] | Clinical reference; symptomatic sample recruited for ocular-surface complaints, aged 15–25 |
| CA-800 TMH repeatability 0.07 mm, ICC 0.93; 0.22 vs 0.17 mm vs Topcon 3D OCT-2000 | Valencia-Nieto 2024 [21] | Clinical reference; one comparison in contact-lens wearers against one OCT platform |
| Keratograph measures first break anywhere on the cornea; 12.35 ± 7.45 s shorter than Tearscope | Best 2012 [24] | Clinical reference, Keratograph only |
| Pentacam BAD-D bands 1.6 / 2.6; Belin/Ambrósio elevation-difference limits anterior 5 / 7 µm, posterior 12 / 16 µm | OCULUS interpretation guide [25], printed p. 36 | Manufacturer-defined, Pentacam only; difference between standard and enhanced reference maps, not raw elevation |
| BAD-D v3/v4 empirical cutoffs ~1.8–1.9 | Lopes 2024 [27] | Clinical reference, Pentacam only |
| ABCD normative: ARC 7.65 ± 0.236 mm, PRC 6.26 ± 0.214 mm, thinnest 534.2 ± 30.36 µm (672 eyes) | Belin and Duncan 2016 [26] | Clinical reference, Pentacam only |
| KISA% cutoff 100; suspect range 60–100; 280/281 correctly classified; K adjusted at 47.2 D, absolute values, floor of 1 | Rabinowitz and Rasheed 1999 [28]; calculation rules as restated in [48] | Clinical reference, videokeratography of that era |
| Klyce/Maeda KPI validation sensitivity 89%, specificity 99% | Maeda 1994 [29] | Clinical reference, TMS-1 |
| KPI >0.23 suggestive; SRI <0.56 normal (TMS) | Cavas-Martínez 2016 [30] | Secondary source |
| I-S >1.4 D; central K >47 D | Attributed via Kuo 2020 [46] | Secondary attribution; primary wording unverified |
| Consensus 2015: posterior elevation and thickness distribution mandatory; 2025 review found evidence lacking for subclinical claim | Randleman 2025 [32] quoting Gomes 2015 [13] | Clinical reference; Edition 2 (2026) statements unverified [33] |
| Arita meiboscore 0–3 definitions; 236 volunteers; R = 0.428 with age | Arita 2008 [17]; definitions restated in Arita 2021 [47] | Clinical reference |
| Pult five-grade scale 0 / <25 / 26–50 / 51–75 / >75% | Pult 2013 [34] | Clinical reference |
| Anterior corneal HOA RMS 0.479 ± 0.124 µm at 6 mm (228 eyes, Atlas) | Wang 2003 [35] | Clinical reference, different device |
| Normal epithelium 52.3 ± 3.6 µm central; PSD cutoff 0.057 | Li 2012 [36] | Clinical reference, RTVue OCT |
| Epithelial thickness not interchangeable across OCT devices; ~4 µm offset | Feng 2023 [37] | Clinical reference |
| Healthy anterior Q −0.24 ± 0.10 at 6 mm | Al-Somali 2023 [6] | Clinical reference, Pentacam |
| Pupil 5.39 / 4.70 / 2.84 mm at 0 / 4 / 250 lux | Rickmann 2017 [7] | Clinical reference, research pupillometer |
| WTW 11.95 ± 0.39 mm | Alotaibi 2025 [8] | Clinical reference, Pentacam AXL Wave |
| TMH varies with method and age; some healthy elderly <0.2 mm | Doughty 2002 [9] | Clinical reference |
| Comparator instrument specifications (ring counts, points, coverage) | Manufacturer pages and manuals [39–45] | Manufacturer-stated |
| ISO 19980:2021 specifies minimum requirements for corneal topographers | ISO [38] | Standard; content not reproduced |
Device-specific descriptions are anchored to the manufacturer manual. Broader clinical reference values are identified separately; none of the external normative studies is presented as a CA-800 normative database. Evidence reviewed through 19 September 2026. For a field that differs from this edition, use the installed-version manual and manufacturer clarification before applying a threshold.
Device and normal-value context
[1] VISIA Imaging / Topcon. CA-800 User Manual. Rev. 18, 07/12/2023; software 1.6.x. Main source for field definitions, module availability and workflow. Page numbers refer to the manual's printed pages.
[2] Topcon Healthcare. CA-800 Corneal Analyzer. Product specifications, functions and report-family inventory. Accessed 17 September 2026.
[3] Topcon. CA-800 Corneal Analyzer brochure, A4 v13, E311. Documents the corneal Zernike implementation and feature terminology.
[4] Wolffsohn JS, et al. TFOS DEWS III: Diagnostic Methodology. Am J Ophthalmol 2025;279:387–450. doi:10.1016/j.ajo.2025.05.033. Diagnostic framework, OSDI-6 screening threshold and NIBUT sign; not a validation of CA-800 5% TBT.
[5] Chen H, Lin H, Lin Z, et al. Distribution of axial length, anterior chamber depth, and corneal curvature in an aged population in South China. BMC Ophthalmol 2016;16. doi:10.1186/s12886-016-0221-5. Population context from IOLMaster, not CA-800 limits.
[6] Al-Somali A, et al. Corneal asphericity and its related factors. Med Hypothesis Discov Innov Ophthalmol 2023;12(3). doi:10.51329/mehdiophthal1479. Healthy-eye anterior Q at 6 mm.
[7] Rickmann A, et al. Digital pupillometry in normal subjects. Neuroophthalmology 2017;41(1). doi:10.1080/01658107.2016.1226345.
[8] Alotaibi WM, et al. Measurements of white-to-white corneal diameter and anterior chamber parameters using the Pentacam AXL wave and their correlations in the adult Saudi population. PeerJ 2025;13. doi:10.7717/peerj.19227.
[9] Doughty MJ, et al. The tear (lacrimal) meniscus height in human eyes: a useful clinical measure or an unusable variable sign? Cont Lens Anterior Eye 2002;25(2). doi:10.1016/S1367-0484(01)00005-4.
Clinical interpretation
[10] Chidi-Egboka NC, et al. Blink rate measured in situ decreases while reading from printed text or digital devices, regardless of task duration, difficulty, or viewing distance. IOVS 2023;64(2):14. doi:10.1167/iovs.64.2.14.
[11] Ousler GW, et al. The Ocular Protection Index. Cornea 2008;27(5). doi:10.1097/ICO.0b013e31816583f6.
[12] Mahmoud AM, et al. CLMI: the cone location and magnitude index. Cornea 2008;27(4):480–487. doi:10.1097/ICO.0b013e31816485d3.
[13] Gomes JAP, et al. Global Consensus on Keratoconus and Ectatic Diseases. Cornea 2015;34:359–369. doi:10.1097/ICO.0000000000000408. Abstract reviewed; full statements quoted via [32].
[14] Hashemi H, Asgari S, Mahmoud AM, et al. Variability of CLMI-X parameters, zonal Kmax, and single-point Kmax in keratoconus progression. Eye 2023. doi:10.1038/s41433-023-02476-1. Repeatability context; CLMI-X is not CA-800 CLMI.
[15] Valencia-Nieto L, López-de la Rosa A, González-García MJ, López-Miguel A. Reliability and agreement of subjective and objective non-invasive break-up time measurements in contact lens wearers. Ophthalmic Physiol Opt 2024;44(1):124–130. doi:10.1111/opo.13243.
[16] Correction to "Reliability and agreement of subjective and objective non-invasive break-up time measurements in contact lens wearers". Ophthalmic Physiol Opt 2025;45:895. doi:10.1111/opo.13470. Existence verified; content not accessible for this edition.
[17] Arita R, Itoh K, Inoue K, Amano S. Noncontact infrared meibography to document age-related changes of the meibomian glands in a normal population. Ophthalmology 2008;115(5):911–915. doi:10.1016/j.ophtha.2007.06.031.
[18] Bron AJ, Evans VE, Smith JA. Grading of corneal and conjunctival staining in the context of other dry eye tests. Cornea 2003;22(7). doi:10.1097/00003226-200310000-00008.
[19] Koch DD, et al. Contribution of posterior corneal astigmatism to total corneal astigmatism. J Cataract Refract Surg 2012. doi:10.1016/j.jcrs.2012.08.036.
Added in Edition 2.0
[20] Topcon Healthcare. CA-800 product page. topconhealthcare.com/products/ca-800. Accessed 19 September 2026.
[21] Valencia-Nieto L, et al. Reliability of tear meniscus height measurements in contact lens wearers and its relationship with discomfort symptoms. Eye Contact Lens 2024:410–415. doi:10.1097/ICL.0000000000001115.
[22] Potenza M, et al. How well does non-invasive tear break-up time reflect patient-reported ocular discomfort? Cont Lens Anterior Eye 2026:102488. doi:10.1016/j.clae.2025.102488.
[23] Uzun SL, Topcu H. Int Ophthalmol 2022:3045–3051. doi:10.1007/s10792-022-02290-w. Non-contact breakup time with CA-800 in university students.
[24] Best N, Drury L, Wolffsohn JS. Clinical evaluation of the Oculus Keratograph. Cont Lens Anterior Eye 2012;35:171–174. doi:10.1016/j.clae.2012.04.002.
[25] OCULUS Optikgeräte. Pentacam Interpretation Guide (EN, 06/2024). pentacam.com. Manufacturer definitions of BAD-D bands, posterior elevation bands, ABCD components and Kmax.
[26] Belin MW, Duncan JK. Keratoconus: the ABCD grading system. Klin Monbl Augenheilkd 2016;233:701–707. doi:10.1055/s-0042-100626.
[27] Lopes BT, Belin MW, et al. Enhancing corneal ectasia susceptibility detection: analysis of a new algorithm (BAD-D v4). Sci Rep 2024;14:30226. doi:10.1038/s41598-024-81809-w.
[28] Rabinowitz YS, Rasheed K. KISA% index: a quantitative videokeratography algorithm embodying minimal topographic criteria for diagnosing keratoconus. J Cataract Refract Surg 1999;25:1327–1335. doi:10.1016/S0886-3350(99)00195-9.
[29] Maeda N, Klyce SD, Smolek MK, Thompson HW. Automated keratoconus screening with corneal topography analysis. Invest Ophthalmol Vis Sci 1994;35:2749–2757. PMID 8188468. No DOI registered.
[30] Cavas-Martínez F, et al. Corneal topography in keratoconus: state of the art. Eye Vis 2016;3:5. doi:10.1186/s40662-016-0036-8. Secondary source for KPI, SRI and SAI definitions.
[31] Shilpy N, et al. Middle East Afr J Ophthalmol 2020;27:156–159. doi:10.4103/meajo.meajo_182_19. Describes ATLAS 9000 PathFinder II classification.
[32] Randleman JB, et al. Evaluating the Global Consensus on Keratoconus and Ectatic Diseases agreements reached on subclinical keratoconus. Am J Ophthalmol 2025;275:27–35. doi:10.1016/j.ajo.2025.03.013.
[33] Gomes JAP, Hafezi F, Ambrósio R, et al. Global Consensus on Keratoconus and Ectatic Diseases — Edition 2. Cornea 2026;45:888–908. doi:10.1097/ICO.0000000000004170. Existence verified; statements not accessible for this edition.
[34] Pult H, Riede-Pult B. Comparison of subjective grading and objective assessment in meibography. Cont Lens Anterior Eye 2013;36:22–27. doi:10.1016/j.clae.2012.10.074.
[35] Wang L, Dai E, Koch DD, Nathoo A. Optical aberrations of the human anterior cornea. J Cataract Refract Surg 2003;29:1514–1521. doi:10.1016/S0886-3350(03)00467-X.
[36] Li Y, Tan O, Brass R, Weiss JL, Huang D. Corneal epithelial thickness mapping by Fourier-domain optical coherence tomography in normal and keratoconic eyes. Ophthalmology 2012;119:2425–2433. doi:10.1016/j.ophtha.2012.06.023.
[37] Feng Y, Reinstein DZ, et al. J Refract Surg 2023;39(7):474–480. doi:10.3928/1081597X-20230606-01. Epithelial thickness repeatability and agreement across MS-39, Anterion and Avanti.
[38] ISO 19980:2021. Ophthalmic instruments — Corneal topographers. Edition 3. iso.org/standard/75922.html.
[39] OCULUS Optikgeräte. Keratograph 5M product page and technical data. oculus.de. Accessed 19 September 2026.
[40] Medmont International. E300 Corneal Topographer User Manual, Section 14 Specifications. medmont.com.
[41] Ziemer Ophthalmic Systems. GALILEI G6 product page. ziemergroup.com. Accessed 19 September 2026.
[42] CSO Italia. MS-39 product page. csoitalia.it. Accessed 19 September 2026.
[43] Tunç U, et al. Eye 2021. doi:10.1038/s41433-020-01238-7. Sirius acquisition description.
[44] Carl Zeiss Meditec. ATLAS 500 corneal topographer product page. zeiss.com. Accessed 19 September 2026.
[45] Tomey. TMS-5 Instruction Manual, specifications. Via ManualsLib. Accessed 19 September 2026.
[46] Kuo BI, et al. Transl Vis Sci Technol 2020;9(2):53. doi:10.1167/tvst.9.2.53. Secondary attribution of the K >47 D, I-S >1.4 D and KISA% >100 criteria.
[47] Arita R, et al. J Clin Med 2021;10:65. doi:10.3390/jcm10010065. Restates the 0–3 meiboscore definitions.
[48] Niazi S, et al. Diagnostics 2023;13:2715. doi:10.3390/diagnostics13162715. Secondary source for the KISA% formula; the K-adjustment, absolute-value and floor-of-one rules are stated in the open-access methods literature (PMC3273406).
What the CA-800 measures. The anterior corneal surface by Placido reflection; tear-film stability, meniscus height and blink behaviour over that surface; pupil diameter and dynamics under programmed light; meibomian gland structure by infrared; fluorescein pattern by blue light. It does not measure the posterior cornea, thickness, epithelium, biomechanics, IOP, osmolarity or the retina.
Reading order. Acquisition validity → what the field actually describes → like-for-like comparison → what would confirm or challenge it.
| If the report shows | Then | Do not |
|---|---|---|
| Green KC class | Anterior pattern not compatible with keratoconus on this scan | Treat it as surgical clearance or as exclusion of posterior or thickness abnormality |
| Yellow or red KC class | Repeat with good quality; review lens history and surface; obtain tomography and pachymetry | Apply K >47 D, I-S >1.4 D, KISA% or BAD-D thresholds to it |
| HEIGHT residual | Anterior departure from the selected reference at the selected diameter | Compare with Pentacam elevation-difference limits or across different references |
| Zernike RMS | Anterior corneal aberration at the stated aperture and term set | Compare across apertures or with another device's HOA total |
| 5% Level TBT | Time to 5% of sectors broken; Δ is the average of included acquisitions | Chart as "NIBUT" without the endpoint, equate to first-break, or read Δ as change |
| > Duration | Endpoint not reached; a lower bound | Convert to the duration value or to zero |
| OPI ≥ 1 | 5% endpoint after mean blink interval | Conclude the surface is protected from focal early breakup |
| TMH < 0.2 mm | Possible low reservoir; corroborate | Diagnose aqueous deficiency from one image; the one published comparison found the CA-800 higher than an OCT platform |
| Meibography % loss | Visible structural loss in the selected region | Report as a grade without naming the scale; infer secretory function |
| Toric module AL, ACD | Entered external values | Treat as CA-800 measurements |
Orientation values, not thresholds. Central K ~43–44 D; anterior Q ~ −0.2 to −0.3; WTW ~11–12.5 mm; photopic pupil ~2–4 mm, scotopic ~4–8 mm; blink rate ~10–20/min; TMH guide ~0.2–0.3 mm; anterior HOA RMS ~0.48 µm at 6 mm on one Placido device.
The DEWS III sign. OSDI-6 ≥4 plus NIBUT <10 s (or hyperosmolarity, or staining thresholds) gives a diagnosis of dry eye. Record which NIBUT endpoint the CA-800 reported; the 5% level is not formally the same measurement.
Published CA-800 reliability. NIBUT repeatability ~4–7 s measured through a soft lens (no lens-off figure published), shorter than a subjective method in that study, weakly related to symptoms. TMH repeatability 0.07 mm; higher than a Topcon OCT in the one published comparison.
Next examination when the question exceeds the device. Scheimpflug or OCT tomography for posterior surface and thickness; epithelial mapping for early ectasia; osmolarity and lid examination for dry-eye mechanism; a validated pupillometer or neuro-ophthalmic assessment for abnormal pupils.
Edition 3.1 (September 2026) incorporates the first clinical review. The Pentacam 12–16 µm limits are re-attributed to the Belin/Ambrósio elevation-difference charts; the KISA% calculation rules are stated in full; the CA-800 NIBUT repeatability study is identified as a pre-lens measurement through soft lenses and the 3.18 s study as a symptomatic sample; the tear-meniscus comparison is limited to the one published study and platform; the same-visit repeat spread is reframed as a quality check rather than a progression threshold; and three figures were corrected. No reference value from Edition 2.0 has changed.
This edition has been reviewed. The author and clinical reviewer is Dr. Saikumar Gandapodi, reviewed 23 September 2026. The next scheduled review is twelve months from publication, or earlier on a CA-800 software release, a manufacturer notice or a reader-reported error. Corrections can be sent through the contact page.
Netra Clinical Knowledge Hub. Reading the CA-800 Report: an independent, parameter-level interpretation guide to the Topcon CA-800 Corneal Analyzer. Edition 3.1. South Plainfield, NJ: Netra Eye Institute; September 2026. Available from this page.
Topcon and CA-800 are trademarks of Topcon Corporation. Pentacam and Keratograph are trademarks of OCULUS Optikgeräte GmbH; ATLAS and CIRRUS of Carl Zeiss Meditec AG; TMS of Tomey Corporation; Sirius and MS-39 of CSO S.r.l.; Medmont of Medmont International; GALILEI of Ziemer Ophthalmic Systems AG; SPECTRALIS of Heidelberg Engineering GmbH. All product names are used only to identify the instruments discussed. This guide is an independent educational publication of the Netra Clinical Knowledge Hub, funded by Netra Eye Institute, a clinical practice that does not manufacture, sell or distribute diagnostic instruments and received no manufacturer support. It is not produced, sponsored, reviewed or endorsed by any manufacturer and does not replace the instrument’s user manual. No manufacturer screen, manual figure, journal figure or patient image is reproduced; every illustration is an original schematic or simulation drawn from the cited field definitions and labelled as such. Netra offers clinical services for several of the conditions discussed; the guide does not describe or recommend those services.
Reading the CA-800 Report, Edition 3.1 — illustrated, 70 pages, A4, 5 MB. Free for clinical and educational use; please link to this page rather than re-hosting the file so that readers always receive the current edition.