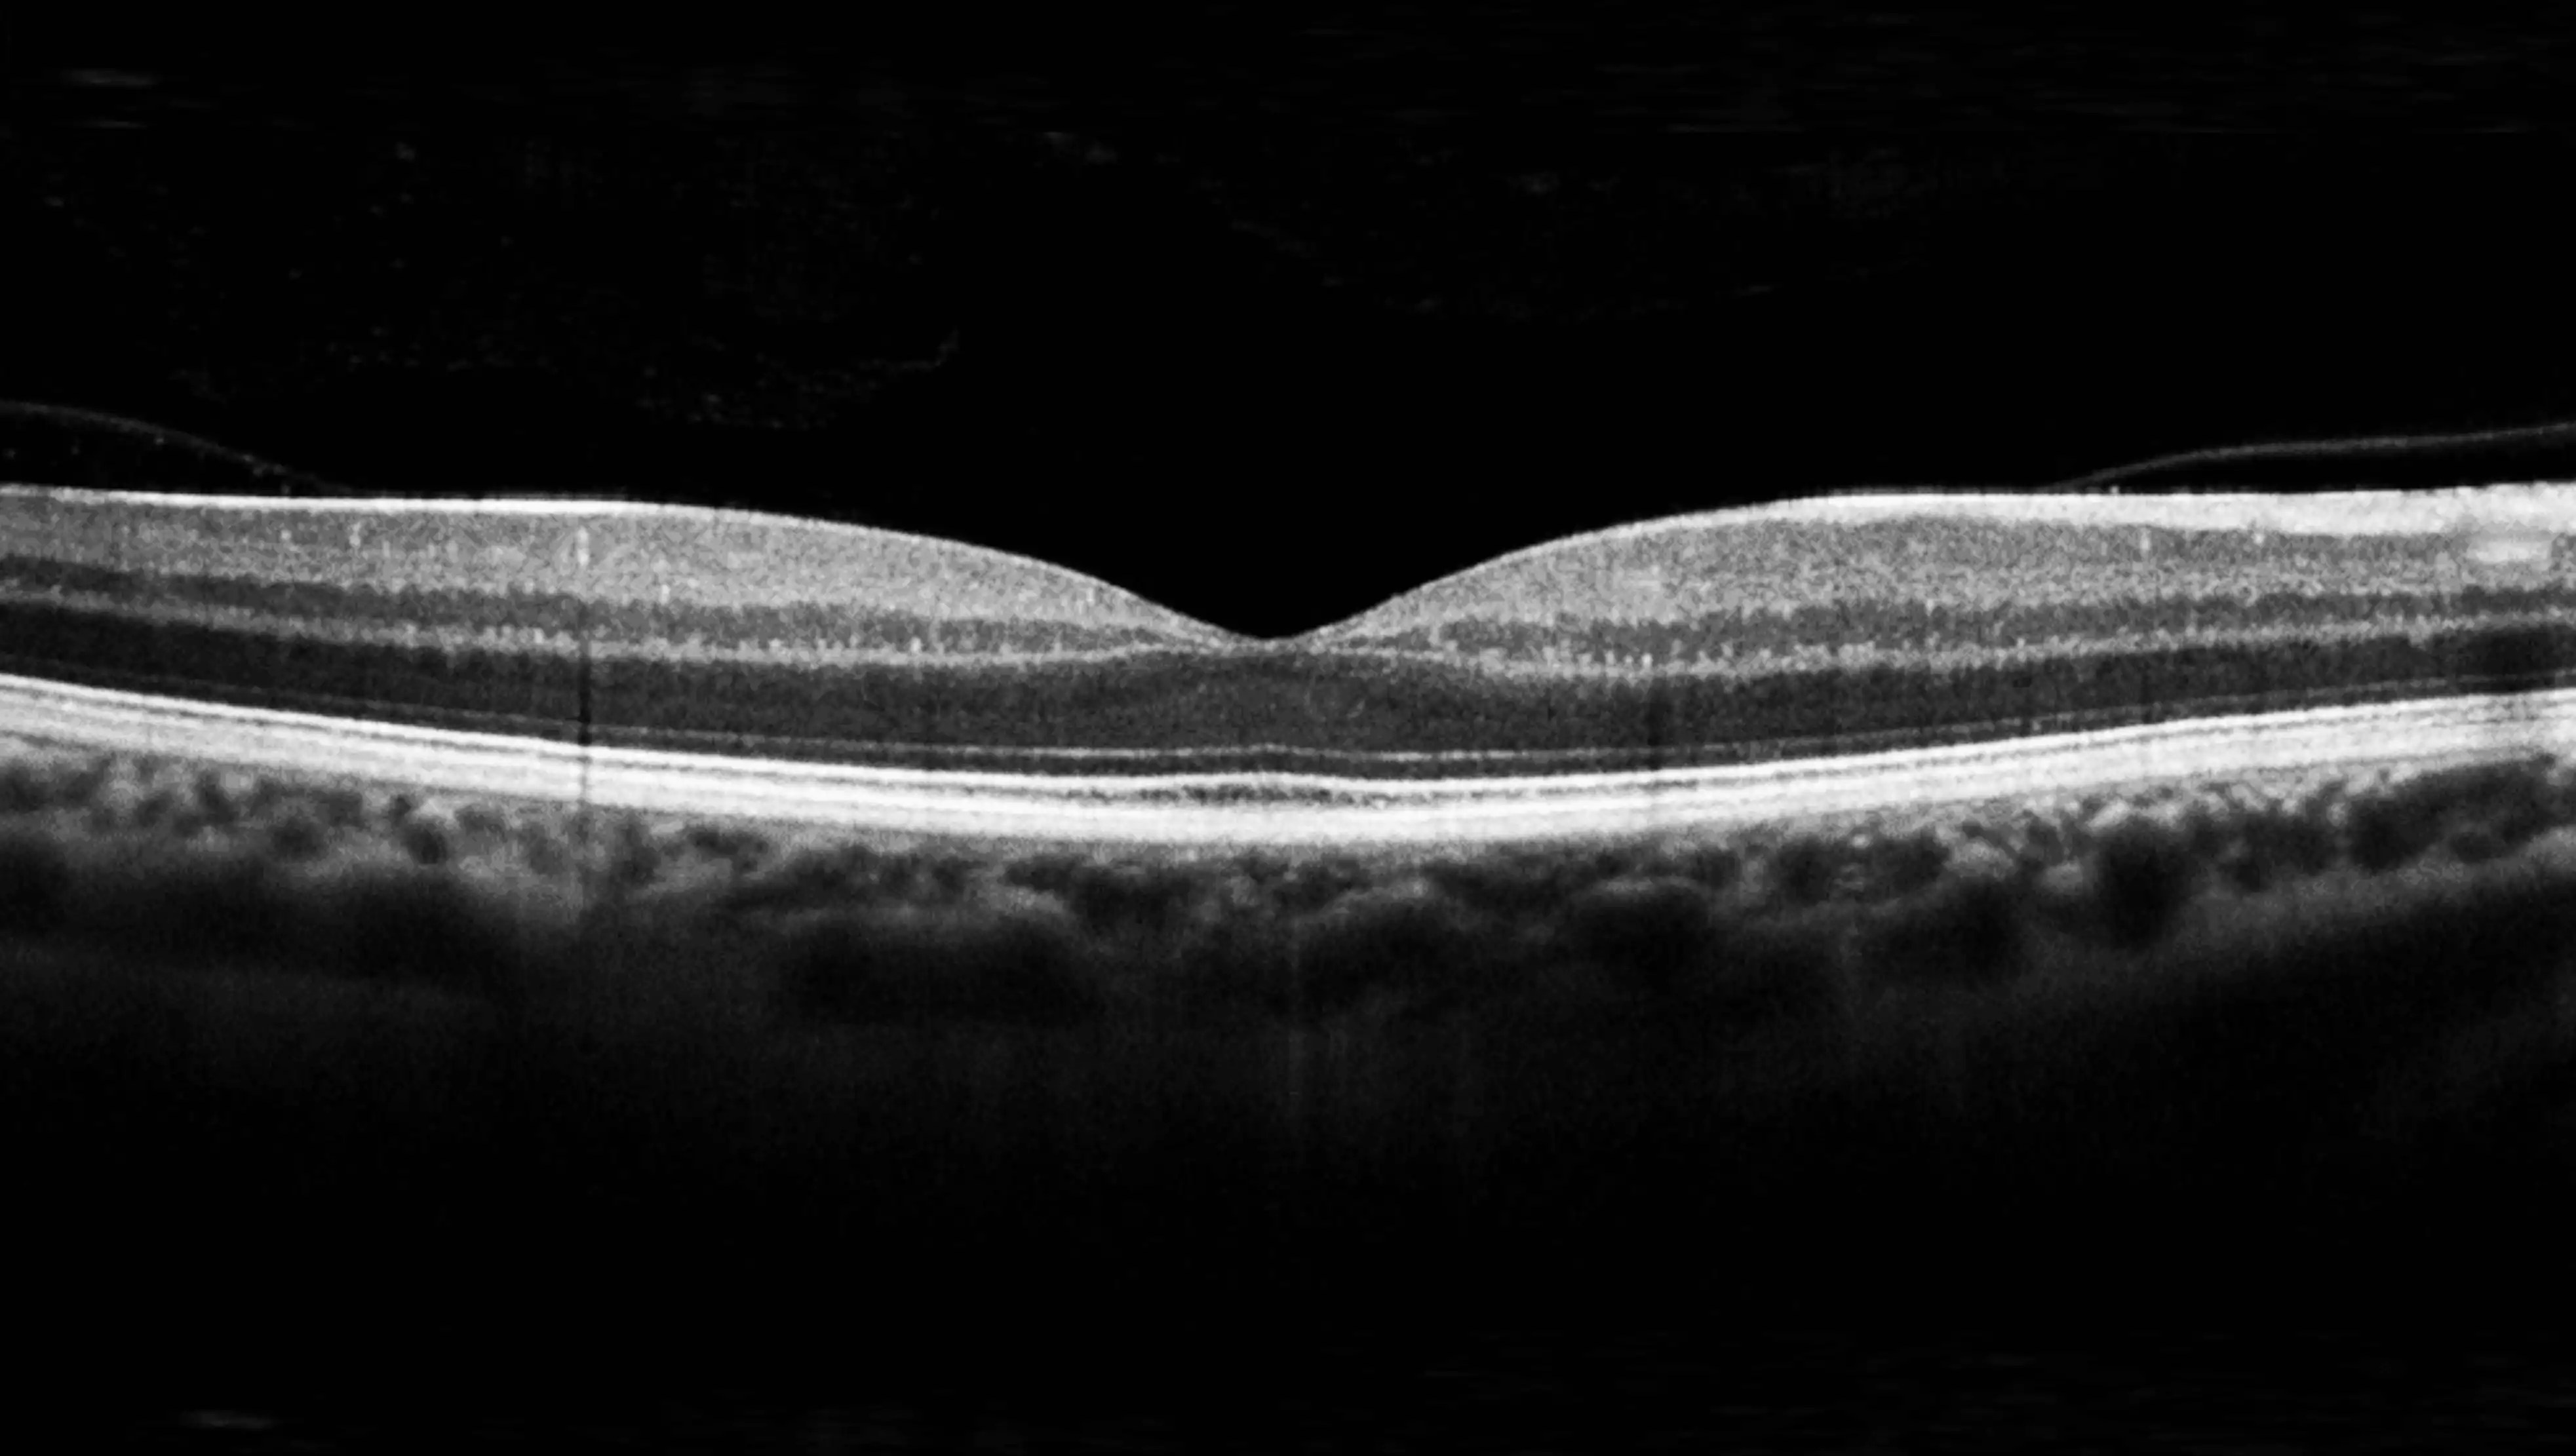
Clinical guide
A clinician-facing review of what central subfield thickness does and does not measure: ETDRS grid geometry, segmentation and device dependence, normal values, trial thresholds, the structure-function relationship, and disease-specific interpretation across 17 macular and optic nerve conditions.
September 23, 2026
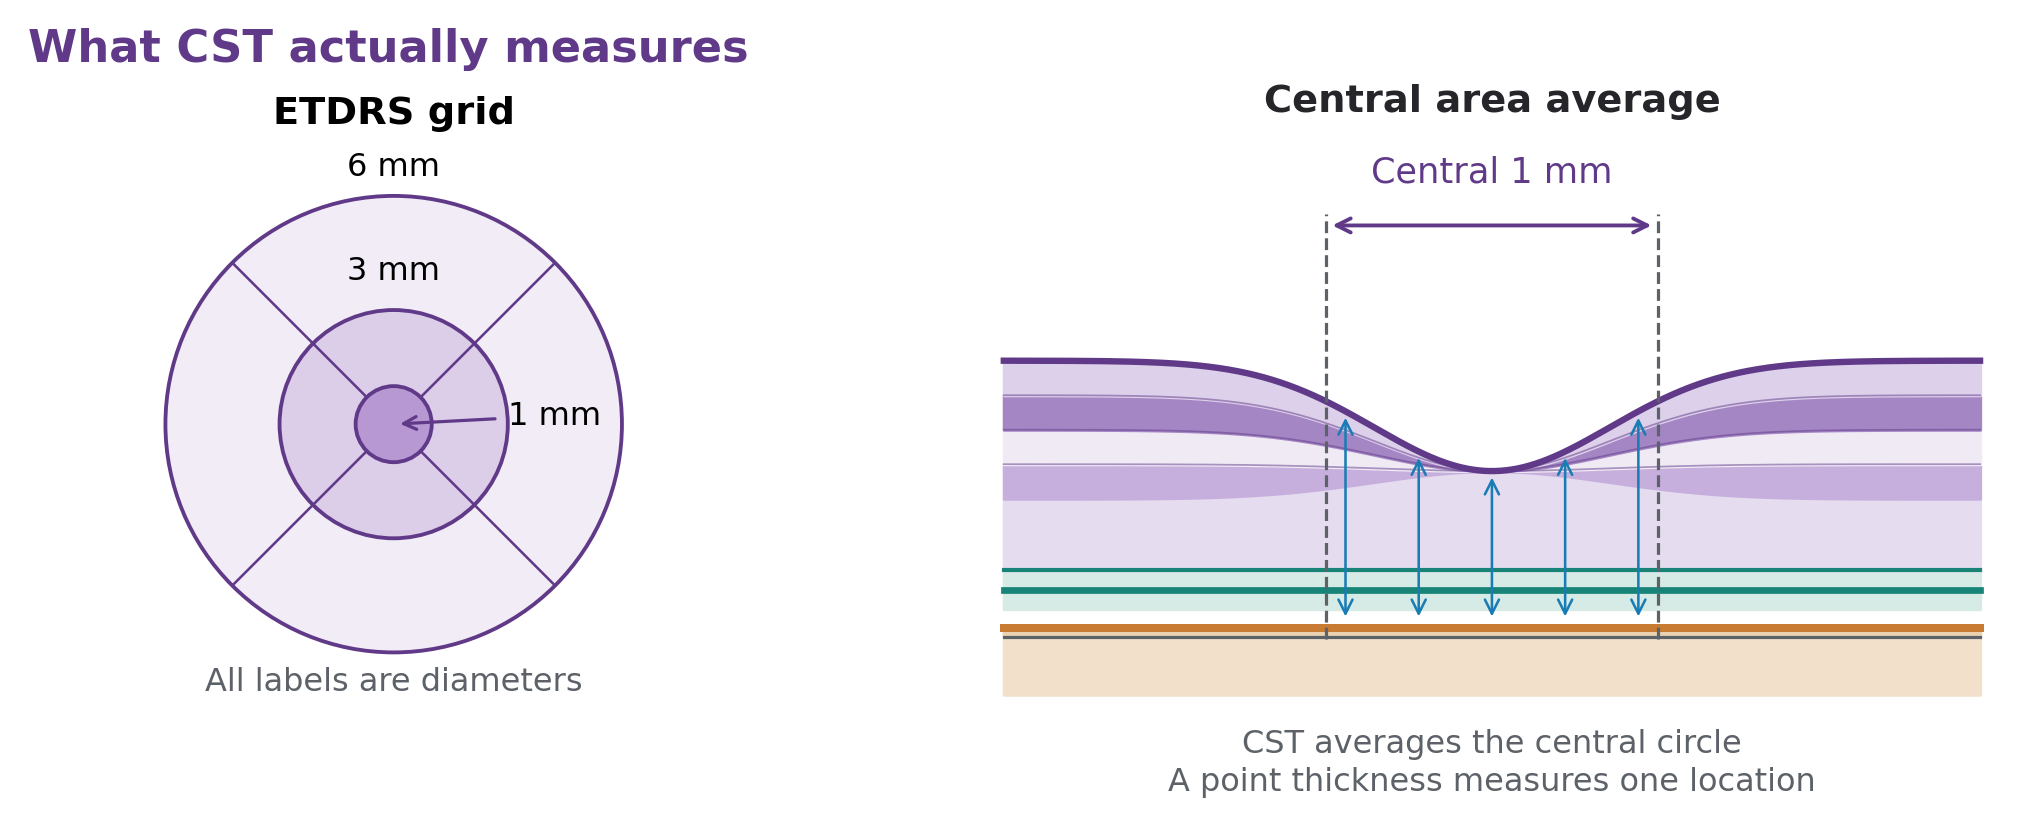
Central subfield thickness (CST) is the mean retinal thickness within the central 1-mm-diameter circle of a macular optical coherence tomography (OCT) thickness map, ordinarily centered on the anatomical fovea. It is reported in micrometers (µm). The central circle has a radius of 0.5 mm and an area of approximately 0.785 mm². CST therefore summarizes a small area containing the foveal center and surrounding tissue; it is not a measurement of the entire macula, and it is not simply the depth of the retina at the lowest point of the foveal pit. OCT provides the cross-sectional data from which software identifies retinal boundaries and calculates the mean. [1, 2]
The clinical value of CST is greatest when it is used to answer a defined question: Is the central retina swollen? Has edema improved? Is a change reproducible? Does apparent thinning represent recovery from fluid accumulation, or loss of neural tissue? CST is particularly useful in diabetic macular edema (DME), retinal vein occlusion (RVO), and inflammatory macular edema. Its interpretation becomes less direct in neovascular age-related macular degeneration (AMD), tractional disorders, inherited retinal disease, and optic neuropathy. A thickness value cannot identify the disease mechanism, quantify perfusion, or establish visual potential by itself. [3, 4, 5]
The conventional Early Treatment Diabetic Retinopathy Study (ETDRS) grid uses concentric circles with diameters of 1, 3, and 6 mm. The central circle is one subfield; the inner and outer rings are each divided into superior, inferior, nasal, and temporal sectors. The central 1-mm subfield should not be called a 1-mm-radius region. Equally, the 6-mm measurement grid is an imaging convention rather than an exact anatomical definition of the macular boundary. The grid is useful because it standardizes location, allowing central disease to be distinguished from parafoveal or more peripheral macular abnormalities. [6, 7]
A useful geometric example is a uniformly measured CST of 300 µm. Multiplying 0.300 mm by the central subfield area gives approximately 0.236 mm³ of segmented central retinal volume. This is a geometric illustration, not an estimate of edema volume: normal retinal tissue accounts for much of that volume. An eye with a 300-µm CST may contain no fluid, while another eye with the same CST may have cystic spaces and substantial pre-existing tissue loss.
| Measurement | Region or quantity | Main interpretive limitation |
|---|---|---|
| Central subfield thickness | Average within the central 1-mm-diameter circle | Averages together normal and abnormal tissue |
| Center-point or central foveal thickness | Thickness at one selected central location | Highly sensitive to exact centering and local anatomy |
| Minimum foveal thickness | Thinnest sampled point near the fovea | May be misleading in holes, atrophy, or decentered scans |
| Central macular or central retinal thickness | Terminology varies between publications and devices | Read the methods to determine whether this means CST or a point measurement |
| Macular cube mean thickness or volume | Average or volume over a larger scan region | Can dilute a focal central abnormality |
| Subfoveal choroidal thickness | Choroid beneath the fovea | A different tissue compartment and biomarker |
The abbreviation CMT is especially inconsistent. A publication reporting “central macular thickness” may mean the average central ETDRS subfield, a single foveal caliper measurement, or a device-specific quantity. Before comparing studies, establish the region, inner and outer boundaries, device, software, and treatment of segmentation errors. Historical center-point studies remain informative, but their numerical results should not be relabeled as contemporary CST measurements. [6, 8, 9]
The macula contains a central specialization for high-acuity vision. The foveal pit develops through displacement of inner retinal layers away from the center, accompanied by cone packing and elongation of foveal photoreceptor segments. The foveola is much smaller than the central ETDRS subfield. Consequently, CST averages the relatively thin central pit together with its thicker surrounding slopes. It cannot be interpreted as a direct count of foveal cones. Histologic studies show substantial interindividual variation in cone packing and foveal architecture. [10, 11]
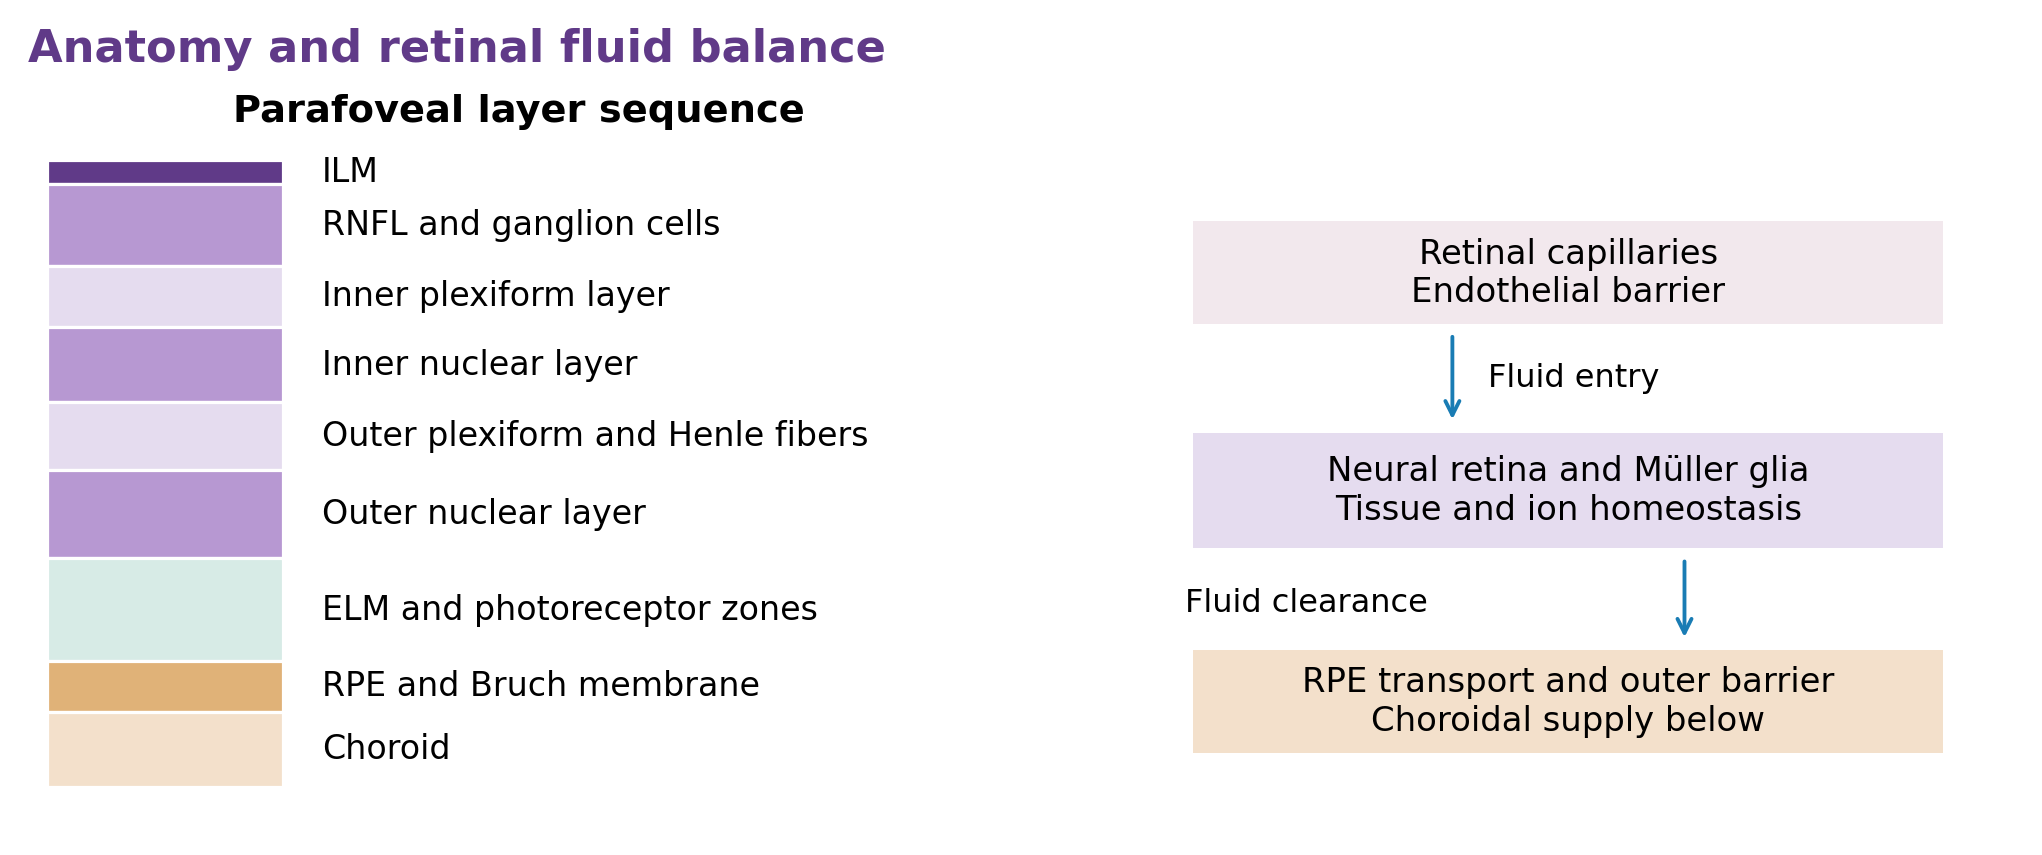
From vitreous toward choroid, the major structures relevant to OCT interpretation are the internal limiting membrane (ILM), retinal nerve fiber layer, ganglion cell layer, inner plexiform layer, inner nuclear layer, outer plexiform and Henle fiber region, outer nuclear layer, external limiting membrane (ELM), photoreceptor-associated outer retinal bands, and retinal pigment epithelium (RPE)–Bruch membrane complex. Several OCT bands represent optical interfaces or zones rather than isolated histologic membranes. The ellipsoid zone (EZ), for example, is an OCT reflectivity feature associated with the photoreceptor inner segment ellipsoid region. [12]
At the normal foveal center, many inner retinal elements are displaced laterally; the parafovea contains much more ganglion cell tissue. This distribution explains why central full-retinal thickness is a poor substitute for ganglion cell–inner plexiform layer (GCIPL) or ganglion cell complex (GCC) measurements. It also explains why a high CST in foveal hypoplasia can reflect retained inner layers rather than edema. In an epiretinal membrane, the appearance of continuous ectopic inner foveal layers represents acquired distortion of a normally specialized architecture. [10, 13, 14]
The inner retina receives blood from the retinal circulation, whereas the outer retina depends heavily on the choroidal circulation across the RPE. Retinal capillary networks are organized at different depths, and the central foveal avascular zone is a vascular territory, not a fixed synonym for the central 1-mm OCT circle. Its size and shape vary. A normally thick retina can nevertheless have substantial capillary nonperfusion. Conversely, vascular leakage can produce thickening before irreversible neuronal loss is apparent. [15, 16]
Retinal hydration reflects the balance between fluid entry, tissue distribution, and removal. Endothelial tight junctions contribute to the inner blood–retinal barrier; RPE junctions and polarized epithelial transport contribute to the outer barrier and subretinal fluid regulation. Experimental work links VEGF signaling to altered occludin trafficking and vascular permeability. Human RPE experiments demonstrate regulated ion-coupled fluid transport. These mechanisms help explain why vascular leakage, inflammatory barrier dysfunction, and impaired RPE transport can generate different patterns of thickening. They do not permit the cytokine concentration or transport capacity of an individual eye to be inferred from its CST. [17, 18]
Müller glia provide structural and metabolic support and participate in retinal ion and water homeostasis. Mechanical separation of retinal tissue and glial dysfunction can produce cavities with appearances resembling edema. Henle fibers also influence the distribution and shape of fluid around the fovea. The important clinical distinction is between extracellular leakage, intracellular swelling, mechanical schisis, and degenerative tissue cavitation. They can all change the apparent thickness while requiring very different investigations and management. [10, 5, 19]
OCT does not weigh or directly sample retinal tissue. It records optical signals and reconstructs their position using assumptions about optical path length. Automated segmentation then determines the separation between selected surfaces at many sampled locations. CST is calculated from the resulting thickness map. Device manufacturers and software generations do not always choose identical outer boundaries. Spectral-domain and swept-source instruments can therefore disagree even when imaging the same healthy eye during the same visit. [1, 9]
In a 2024 comparison involving 21 healthy participants, mean central measurements differed across PLEX Elite, Spectralis, DRI OCT-1, and Cirrus. The reported values were approximately 279, 272, 240, and 257 µm, respectively. These figures illustrate instrument dependence; the small sample does not establish universal normal values for those devices. Differences of several tens of micrometers between platforms can be technical rather than biological. [9]
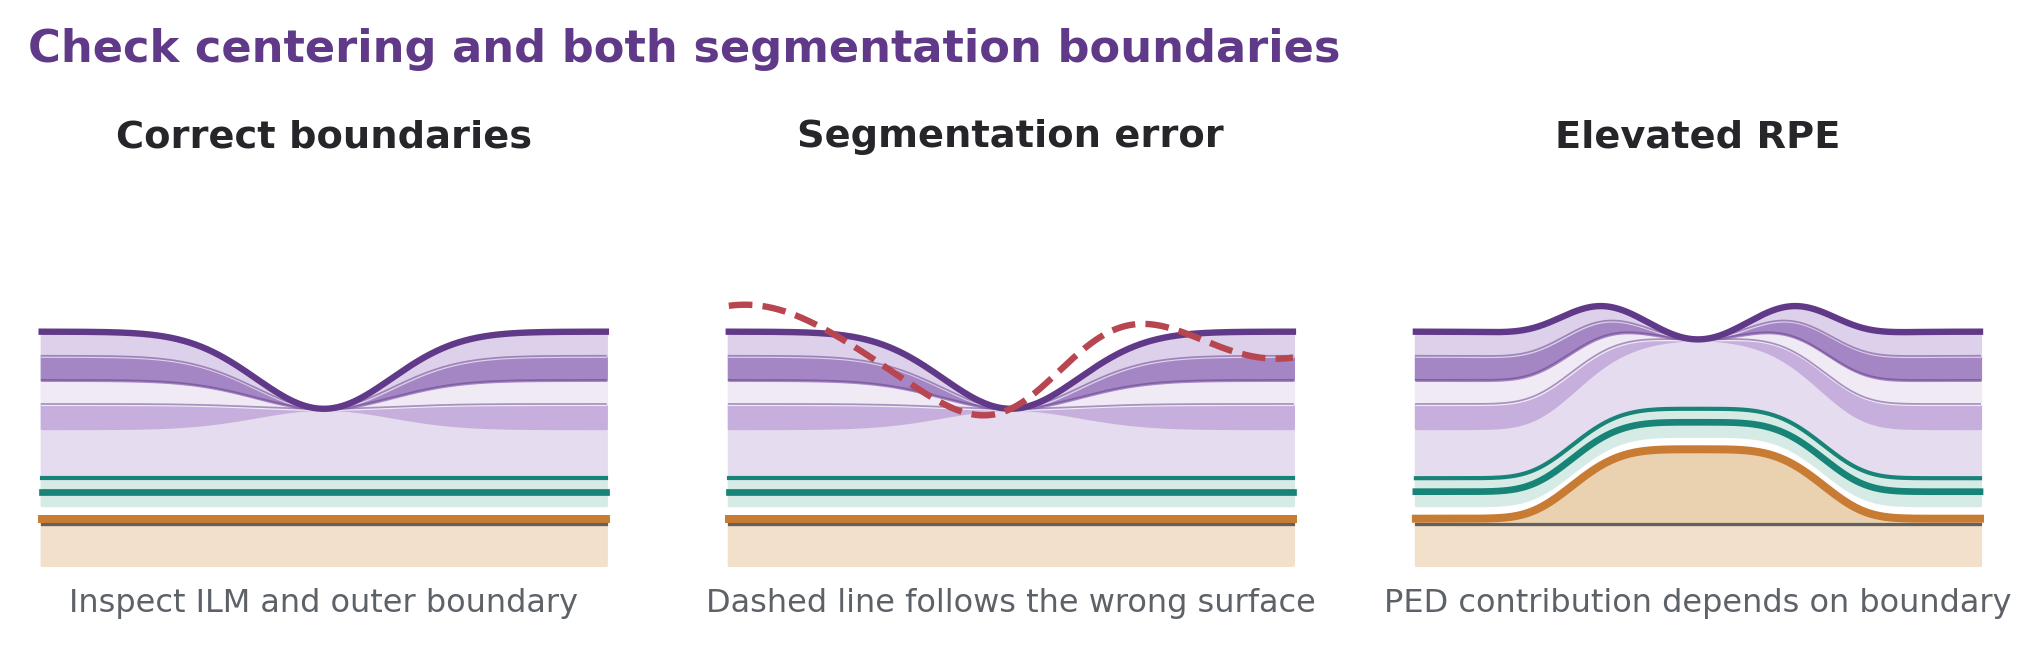
The handling of subretinal fluid and pigment epithelial detachment (PED) also depends on the output being inspected. An ILM-to-RPE or ILM-to-Bruch membrane measurement may span subretinal fluid rather than isolate neural retina. Whether a PED contributes to a reported total thickness depends on the exact outer boundary and software implementation. Inspect the segmentation lines on the actual scan instead of assuming that “retinal thickness” consistently excludes every non-neural compartment. [2, 12]
Published conversion equations can harmonize research datasets. Sun and colleagues derived Cirrus-to-Spectralis and reverse conversions in DME, but individual predictions retained substantial uncertainty. The two regressions are not algebraic inverses because each was fitted to predict a different dependent variable. They should not be used to manufacture a precise longitudinal change when a patient switches devices. A new instrument preferably requires overlapping baseline scans and separate documentation of the platform change. [2]
Decentration may shift the central circle from the pit onto a thicker parafoveal slope. Motion can duplicate or displace anatomy. Blinks and media opacity reduce usable signal. Automated boundaries can follow an epiretinal membrane, the wrong reflective band, the roof of a cyst, a druse, or a detached RPE contour. High myopia and posterior staphyloma alter geometry and can increase segmentation difficulty. Large holes and severe edema are particularly vulnerable to boundary errors. [20, 5, 21]
The practical quality check is to inspect the volume rather than only its central B-scan or color map. Confirm that the central circle is anatomically centered, assess scan completeness, and trace both segmentation boundaries through the lesion. Review neighboring scans when a boundary becomes implausible. If manual corrections are made, record the correction and apply consistent rules to comparison visits. A green normative color code does not validate incorrect segmentation.
Axial length deserves separate attention. Ocular magnification influences the actual retinal area corresponding to a nominal scan dimension. This can change the tissue sampled by the central grid without implying that the physical retina has thickened. In markedly long or short eyes, use the instrument's supported biometric correction and interpretation guidance, and avoid a universal correction factor applied retrospectively without validation. The measured central region and a patient's full macular topography both matter. [22]
Normal CST varies with the instrument, segmentation convention, sex, population, axial length, and foveal anatomy. Age effects are also region-specific: aging may reduce parafoveal or total macular thickness without producing the same central-subfield change. Healthy-eye research should be read as a description of a defined cohort, not a universal diagnostic threshold. Adult norms are not automatically suitable for children, eyes with high myopia, or congenital foveal abnormalities. [6, 7, 13]
A population-based study published in May 2026 analyzed 4,013 eyes from 2,205 adults aged 50–74 years in Shahroud, Iran, using Spectralis. Mean CST was 264 ± 22 µm, with means of 271 µm in men and 259 µm in women. The 95th percentile was 301 µm. Eyes with specified ocular disease, surgery, poor acuity, high myopia, and statistical outliers were excluded. These results strengthen the case for population- and device-aware interpretation; they do not make 301 µm a universal edema threshold. The narrow confidence interval around the population mean must not be mistaken for the range expected in individual patients. [7]
For comparison, an earlier Spectralis study reported a mean central subfield value near 270 µm and a substantially lower mean center-point value near 227 µm. The difference is anatomically plausible because the subfield includes the surrounding foveal slopes. These two measurements should not be compared as though they were competing estimates of the same quantity. [6]
| Example from DRCR DME research | Women | Men | Meaning |
|---|---|---|---|
| Cirrus central subfield | ≥290 µm | ≥305 µm | Device- and sex-specific threshold used in defined DME protocols |
| Spectralis central subfield | ≥305 µm | ≥320 µm | Corresponding protocol threshold on a different platform |
These values are examples of operational criteria used in DME research. They are not treatment mandates or interchangeable cutoffs for AMD, uveitis, childhood disease, or every software release. Diagnosis still requires compatible morphology and clinical context. A small cyst in an otherwise thin retina can represent central edema below such a threshold; a thick but structurally normal fovea may exceed a cutoff without leakage. [2, 23]
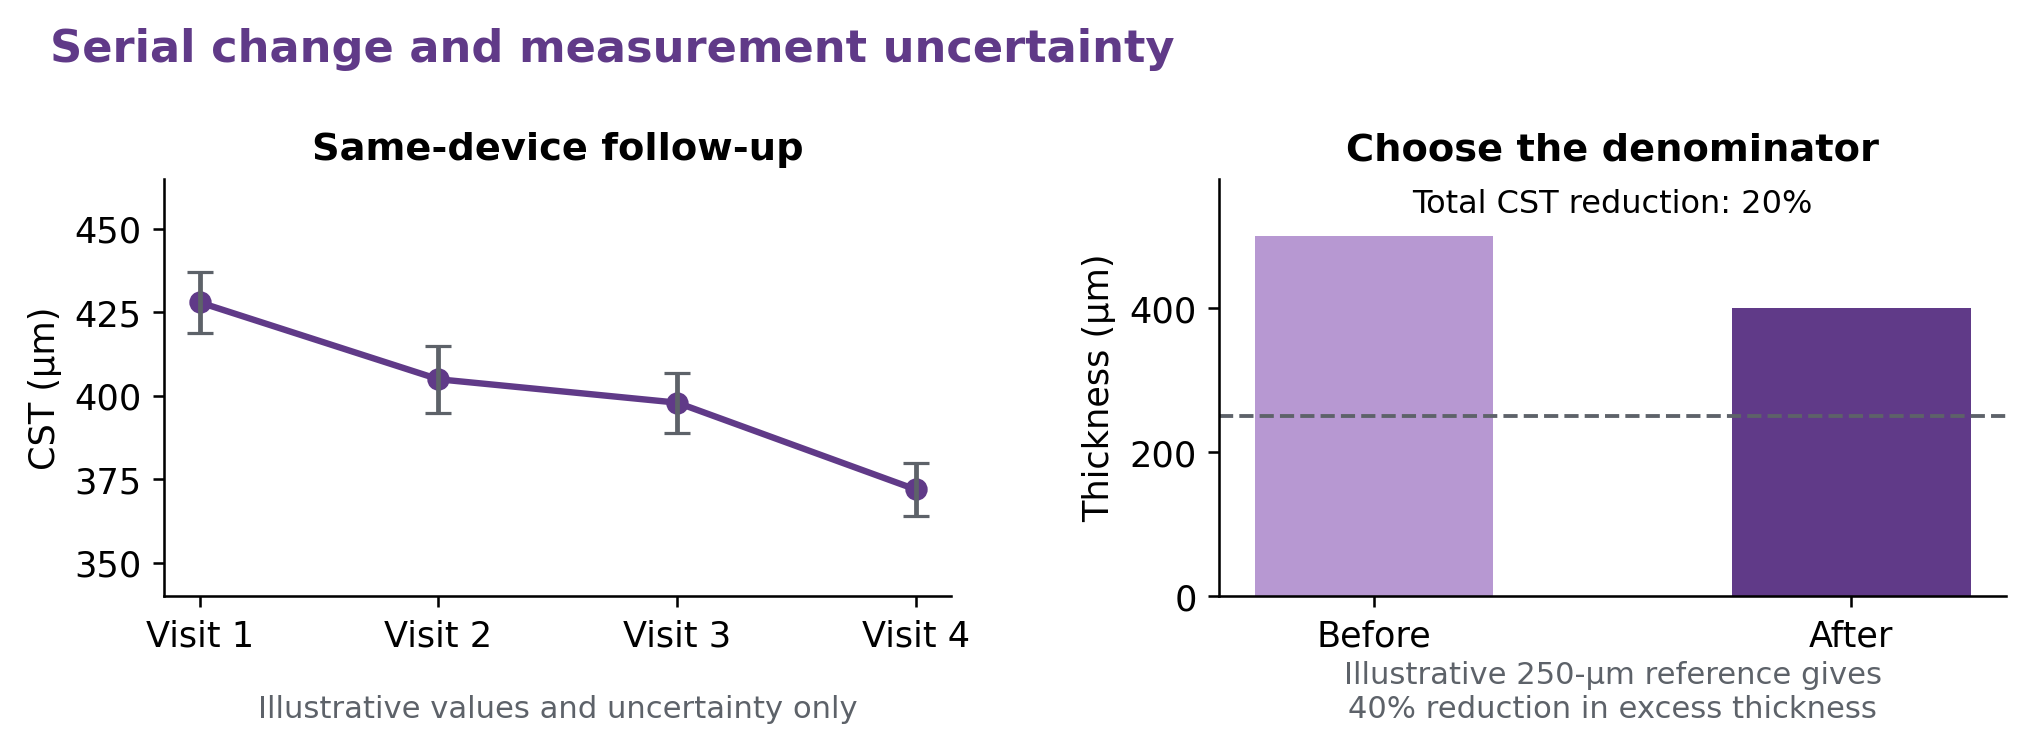
Serial monitoring is most reliable when device, scan pattern, software, registration, signal quality, and segmentation practice remain consistent. The 2014 DRCR reproducibility study reported relative CST repeatability coefficients of 7% for Spectralis and 14% for Cirrus in its DME cohort. Those historical results should not be treated as fixed performance specifications for current equipment. They show why a universal 5-µm or 10-µm “response” criterion is inappropriate across devices and disease states. [20]
A 10% change has been useful in selected trial algorithms, but clinical interpretation should also consider absolute change, baseline thickness, newly appearing fluid, and repeat-scan confidence. For illustration, a reduction from 500 to 400 µm is a 100-µm absolute reduction and a 20% reduction in total CST. If an illustrative reference of 250 µm is chosen, excess thickness falls from 250 to 150 µm, a 40% reduction in excess thickness. These are different denominators. Neither percentage should be reported simply as “40% retinal recovery.”
Time of day can matter in DME, although the magnitude varies between eyes. Treatment timing, systemic fluid status, and posture may also complicate interpretation. A repeat scan is often appropriate when a small isolated change conflicts with morphology and vision. By contrast, a new symptomatic fluid pocket can be clinically important even when it changes the central average very little. [24, 20]
CST is a structural biomarker. Best-corrected visual acuity (BCVA), contrast sensitivity, reading performance, microperimetric sensitivity, and visual fields measure different aspects of function. Their relationship with total thickness is influenced by the integrity of photoreceptors, the ELM and EZ, inner retinal organization, perfusion, foveal localization, fixation, and comorbid disease. A patient may lose central sensitivity without a dramatic change in high-contrast acuity or average CST. [3, 25, 26]
In the Protocol T post hoc analysis, correlations between change in CST and change in visual acuity were approximately 0.36 at 12 and 52 weeks and 0.33 at 104 weeks. Squaring these correlations gives only about 11%–13% shared variation in a simple linear interpretation. These data support using anatomy and function together; they do not support predicting an individual's letter gain from a specific micrometer reduction. The older DRCR center-point study reached a similar clinical conclusion using a different thickness metric. [3, 8]
An intervention may dry the retina without reversing ischemic neuronal loss or chronic photoreceptor disruption. Conversely, improved optical quality after cataract treatment may improve vision without changing the macular disease. Even within the retina, better neural organization and improved fixation may occur with only modest total-thickness change. The appropriate question is whether the pattern of anatomical change is consistent with the functional result and the disease mechanism.
The DRCR dexamethasone add-on trial provides a direct example. In persistent DME, adding an intravitreal dexamethasone implant to continued ranibizumab produced a larger reduction in CST than continued ranibizumab alone, but no additional mean visual-acuity benefit at 24 weeks. IOP elevation was more likely with the combination. This finding does not imply that corticosteroids lack a role in DME; it demonstrates why a more favorable thickness endpoint alone cannot establish superior patient benefit. [27]
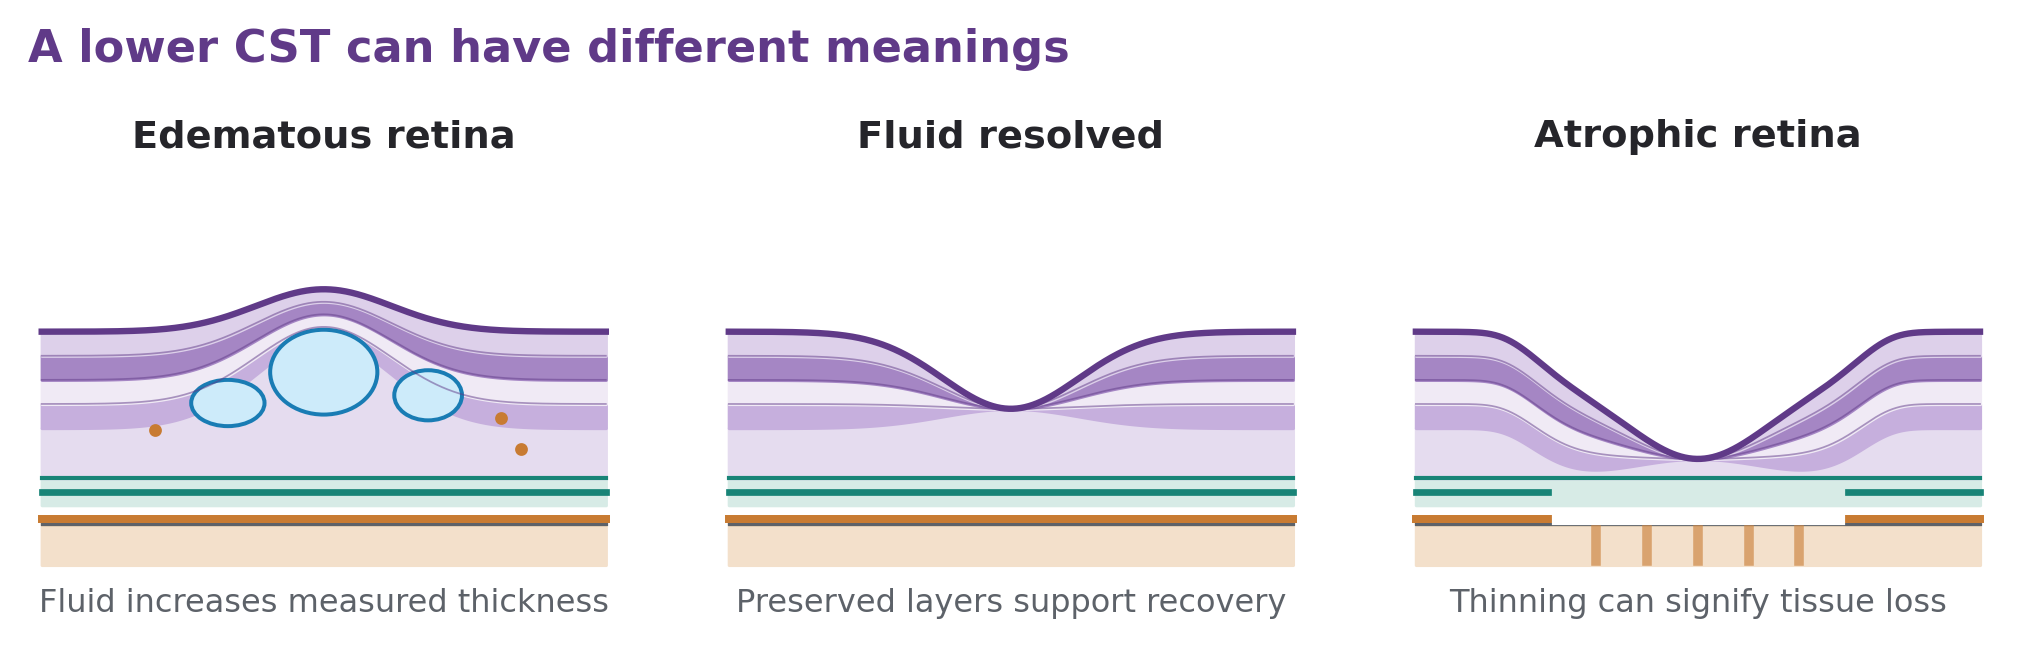
A falling CST has at least three possible meanings: resolution of edema, loss of retinal tissue, or measurement error. A rising CST may reflect recurrent fluid, traction, retained developmental tissue, or the recovery of previously attenuated outer retinal structures. Interpretation must therefore include the mechanism and time course. Successful treatment aims to control the disease while preserving function, rather than simply minimize the number displayed by the OCT software. [28, 29]
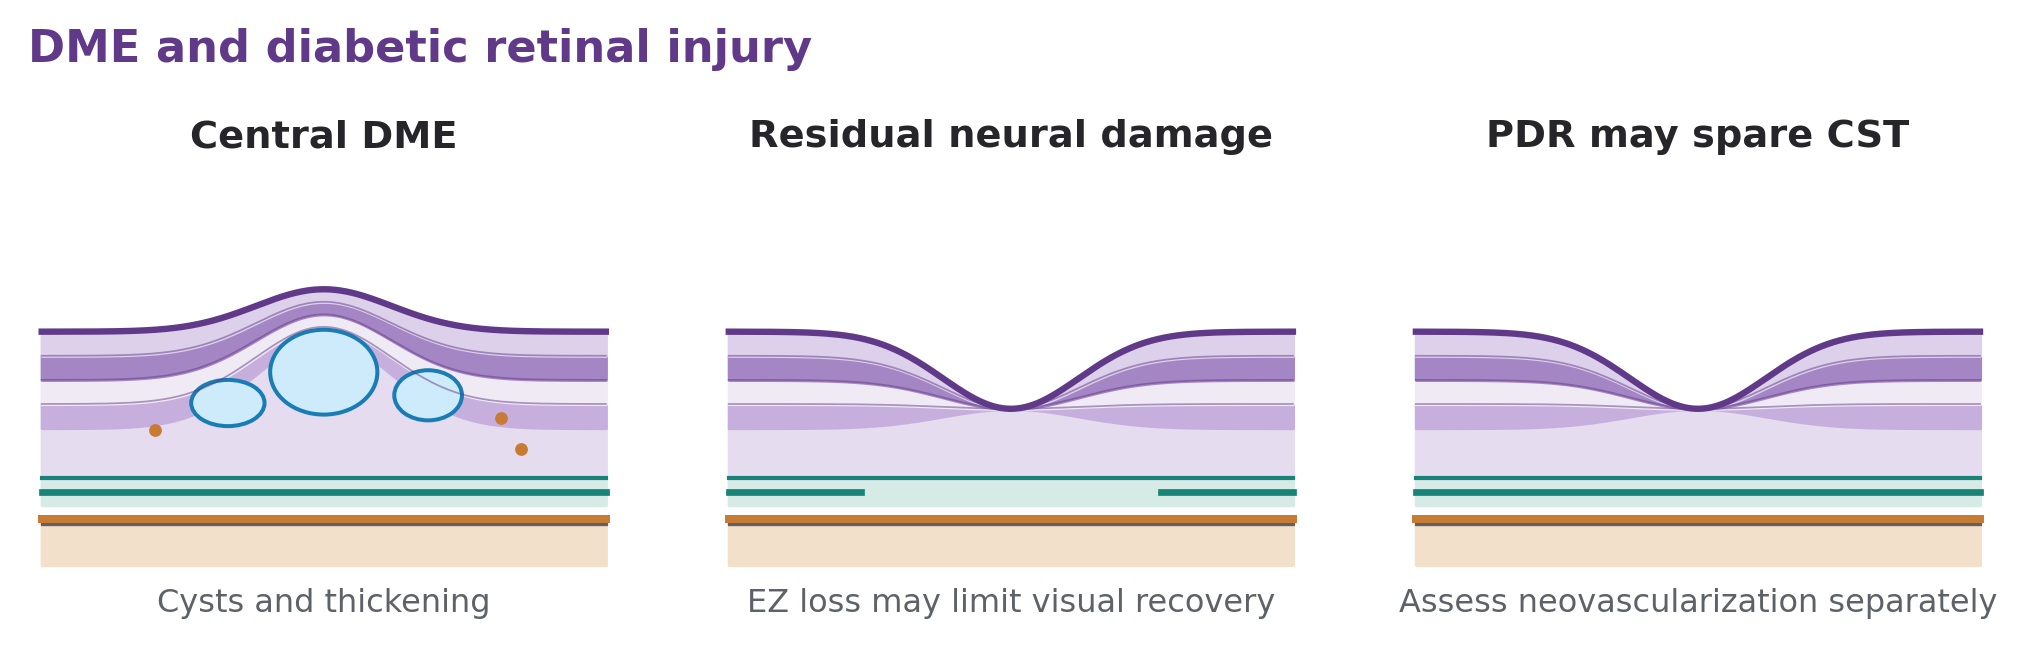
In DME, increased vascular permeability allows fluid to accumulate within and sometimes beneath the retina. OCT may show diffuse thickening, intraretinal cysts, subretinal fluid, hyperreflective foci, traction, and variable disruption of neural layers. CST helps quantify the central component and follow treatment response. The surrounding ETDRS sectors remain important because clinically relevant edema may lie outside the central circle. Fundus examination and appropriate vascular imaging are needed to assess hemorrhage, exudation, ischemia, and retinopathy severity. [30, 31]
Center-involved DME is an anatomical and clinical concept. An automated number exceeding a device-specific threshold is useful for protocol eligibility and standardization, but it cannot replace inspection for actual central thickening or fluid. In a retina with diabetic neurodegeneration or prior ischemic thinning, a relatively normal CST may mask new edema. Longitudinal evidence that neural retinal loss can precede overt microvascular retinopathy further limits the interpretation of total thickness as an isolated measure of diabetic retinal health. [2, 16]
Protocol T established comparative outcomes for aflibercept, bevacizumab, and ranibizumab in vision-impaired center-involved DME. Baseline vision materially influenced comparative treatment benefit. Persistent thickening was more frequent with some regimens, but persistent edema did not invariably mean progressive visual loss. Its secondary analyses caution against attributing every improvement after a switch to the newly selected drug, because improvement may also occur with continued treatment. [30, 32]
Protocol V enrolled eyes with center-involved DME and visual acuity of 20/25 or better. At two years, initial aflibercept, laser, and observation strategies did not differ significantly in the primary vision-loss outcome when the observation and laser groups received aflibercept for prespecified visual deterioration. Approximately one third of initially observed eyes ultimately received aflibercept. Thus, selected patients with good vision can be monitored under an appropriate follow-up and rescue plan. This does not support unmonitored observation or extrapolation to eyes with worse vision, traction, or other causes of visual loss. [33]
Protocol AC addressed a different population, with moderate visual impairment. Bevacizumab first, followed by aflibercept when specified response criteria were met, produced similar visual outcomes over two years to aflibercept monotherapy. Approximately 70% of the bevacizumab-first eyes switched. The switching algorithm combined CST, visual acuity, treatment exposure, and change over time. Its implications concern a structured strategy, rather than a single thickness cutoff applicable to all patients. [23]
The two-year YOSEMITE and RHINE results showed maintained visual gains with faricimab and improvements in anatomical outcomes, with many treat-and-extend participants achieving longer intervals. PHOTON showed that aflibercept 8 mg could maintain noninferior visual gains at extended trial intervals compared with aflibercept 2 mg. CST contributed to monitoring and disease-activity assessment in these programs. Cross-trial comparisons of micrometer reductions, however, are unreliable without accounting for baseline edema, prior treatment, retreatment rules, and imaging methods. [34, 35]
A smaller CST reduction in a mildly thickened eye does not necessarily represent a weaker response than a large reduction in a severely edematous eye. Similarly, “absence of DME” defined by a threshold differs from absence of every intraretinal cyst. Research definitions of strong and weak response emphasize the need to specify the endpoint and account for the amount of edema present initially. Clinicians should document absolute thickness, change, fluid distribution, and visual function separately. [36]
Disorganization of the retinal inner layers (DRIL) describes difficulty distinguishing specified inner retinal layer boundaries over a defined region. Sun and colleagues linked its extent and longitudinal change to vision in center-involved DME. ELM and EZ continuity, the location and size of cysts, and perfusion add complementary information. These features are clinically useful, but most biomarker associations do not establish that one feature can prospectively select the best drug for an individual patient. [25, 3]
CST must also be separated from proliferative diabetic retinopathy (PDR). An eye may have dangerous neovascularization, vitreous hemorrhage, or tractional detachment while central thickness is normal. Protocol S assessed PDR treatment strategies using outcomes beyond macular edema. A favorable CST trend does not establish that PDR is controlled, and a dry macula does not eliminate the need for peripheral examination, neovascular assessment, and reliable follow-up. [37]
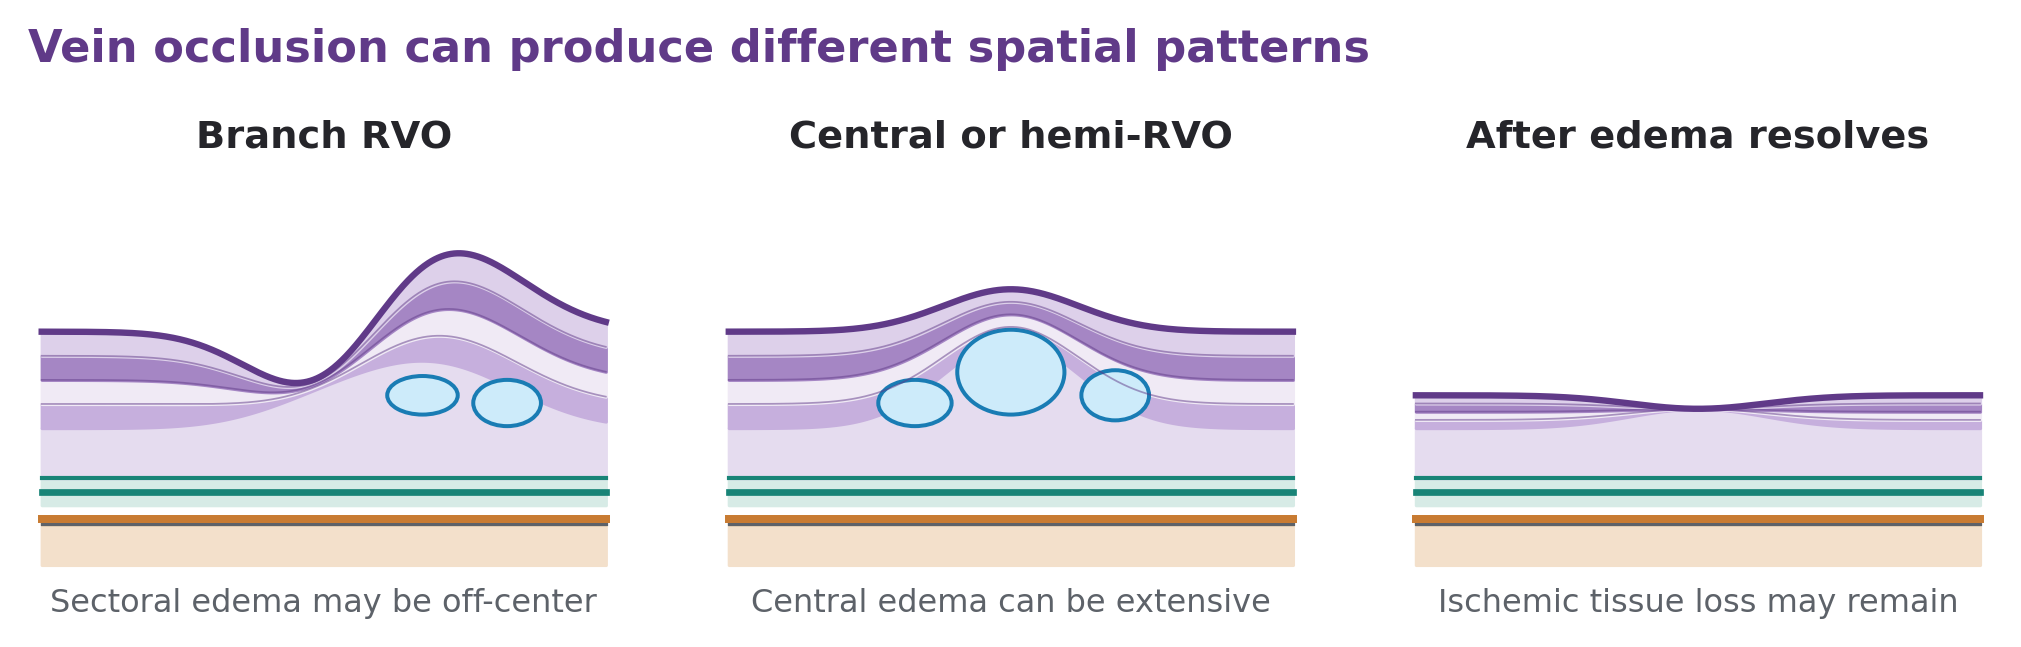
In branch, central, and hemiretinal vein occlusion, venous outflow obstruction and downstream vascular dysfunction can produce extensive intraretinal edema, cyst formation, hemorrhage, and subretinal fluid. CST often changes markedly during treatment and is a useful marker of central edema burden. BRVO may produce a sectoral pattern that extends beyond the central subfield; CRVO may produce more diffuse abnormalities. The distribution on the full volume provides information that the central average cannot retain. [38, 39]
BRAVO and CRUISE established benefits of ranibizumab for edema after branch and central vein occlusion. SCORE2 demonstrated noninferior visual-acuity results for bevacizumab versus aflibercept at six months in central or hemiretinal vein occlusion under its monthly regimen. More recently, BALATON and COMINO reported noninferior visual gains with faricimab versus aflibercept at 24 weeks and comparable mean CST reductions. These trials support CST as a treatment-monitoring variable while maintaining visual function as a central clinical endpoint. [38, 39, 40, 41]
Thickness cannot classify an RVO as ischemic or nonischemic. Marked edema may coexist with differing degrees of capillary nonperfusion, and severe ischemia may eventually leave a thin macula. Iris and angle neovascularization, retinal neovascularization, peripheral nonperfusion, and neovascular glaucoma risk require their own assessment. A dry macula after treatment does not establish vascular recovery. OCT angiography can help assess macular perfusion, but edema, shadowing, projection, and segmentation errors complicate interpretation.
Recent work reinforces the importance of tissue architecture. A 130-eye cohort reported associations between EZ/ELM integrity, DRIL change, and visual outcomes through two years. A small 2026 adaptive-optics OCT study of persistent BRVO edema linked microstructural disorganization beneath foveal cysts to smaller subsequent CST reductions. These are prognostic associations, not validated rules for withholding or selecting treatment. [42, 43]
A 2026 post hoc analysis of aflibercept RVO trials is particularly instructive. In COPERNICUS, groups beginning treatment at different times after diagnosis had broadly similar large CST reductions at week 24, while earlier treatment was associated with greater visual improvement. Because timing was not randomized, causal interpretation requires caution. Nevertheless, the divergence illustrates why a later dry OCT cannot be assumed to reverse all consequences of prior disease duration. [44]
Radiation maculopathy is another vascular setting in which anatomy and function can diverge. In a small randomized aflibercept study, central retinal thickness improved significantly over one year, whereas the overall mean visual-acuity gain was not statistically significant. The underlying capillary injury and neural damage constrain visual recovery. Hypertensive retinopathy, retinal arterial macroaneurysm, and ocular ischemic syndrome may also produce macular fluid, but their systemic and vascular diagnoses cannot be established or excluded by CST. [45]
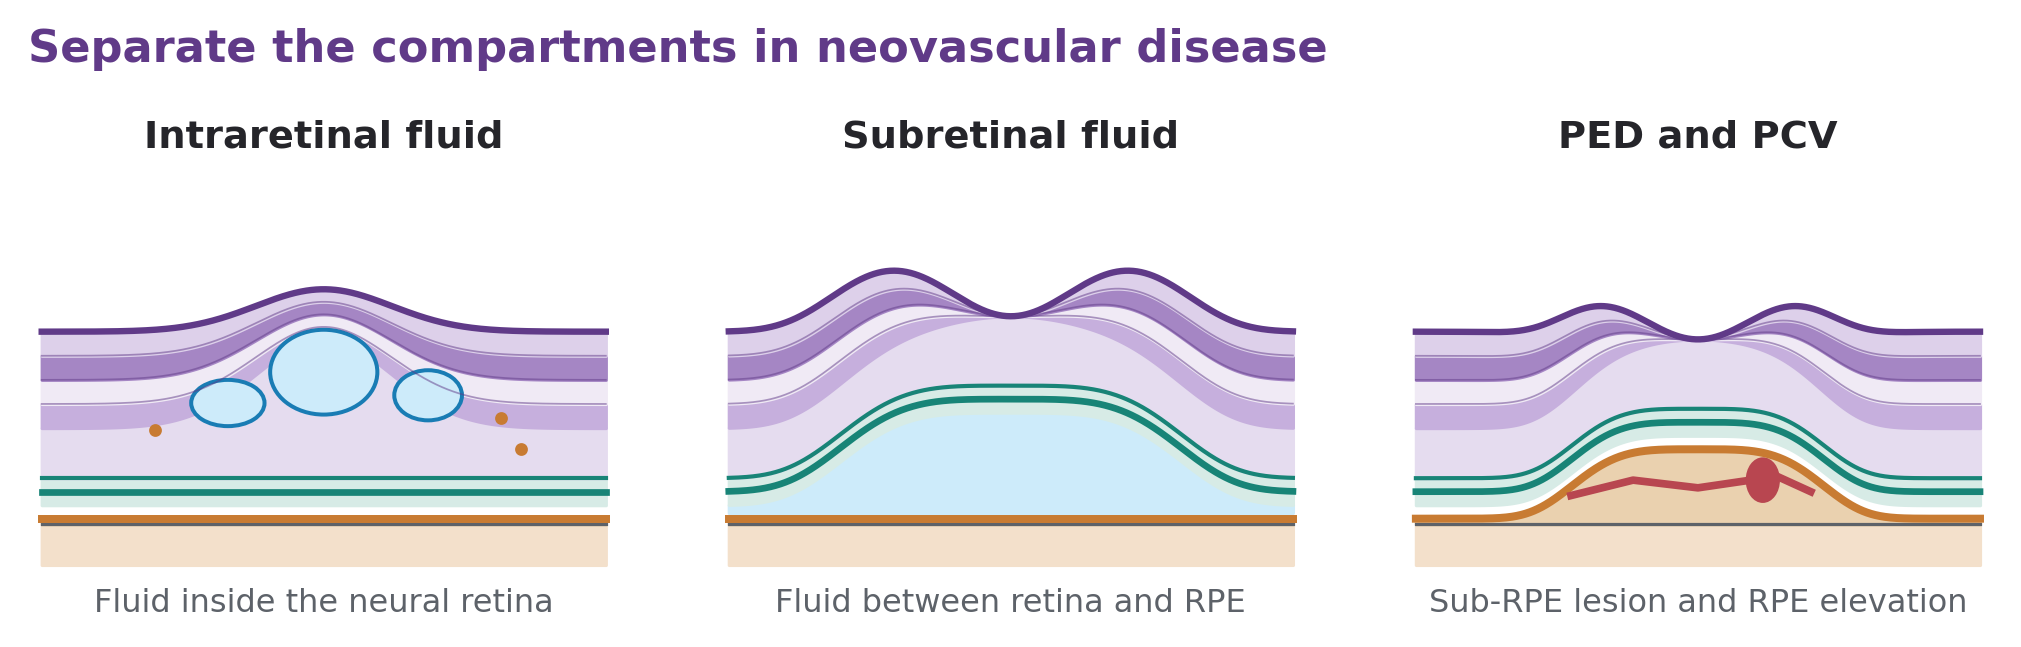
In neovascular AMD, the same CST can arise from very different mixtures of intraretinal fluid, subretinal fluid, subretinal hyperreflective material, PED, fibrosis, and atrophy. The clinician should identify the compartment and activity of each lesion. A central average loses both spatial and compositional information. Fluid close to functioning foveal photoreceptors may have different implications from a stable degenerative cavity in an established scar. [46, 47]
CATT analyses linked intraretinal fluid, especially centrally located fluid, with poorer visual outcomes. Subretinal fluid had a different relationship with vision, and some eyes with persistent subretinal fluid maintained useful acuity. These associations should not be reduced to “all subretinal fluid is protective” or “intraretinal fluid always proves ongoing leakage.” Chronic degenerative spaces and outer retinal tubulation can mimic activity; structural context and change over time remain essential. [46, 48]
The randomized FLUID study tested a specific ranibizumab treat-and-extend strategy. Its relaxed arm tolerated limited subretinal fluid, up to 200 µm at the foveal center, after intraretinal fluid had resolved. Visual outcomes at 24 months were noninferior to an intensive strategy targeting complete fluid resolution, with fewer injections on average. The 200-µm value described subretinal fluid height, not CST. The study does not authorize ignoring new hemorrhage, new intraretinal fluid, deteriorating vision, or all fluid in every AMD phenotype. [47]
TENAYA/LUCERNE and the 96-week PULSAR results support extended dosing strategies with continued anatomical and functional monitoring. Their clinical relevance includes durability and injection burden, not just the size of a CST reduction. Extension decisions should follow the specific regimen and the eye's activity pattern. A normal central average does not prove that a neovascular lesion is inactive elsewhere in the macula. [49, 50]
Long-term thinning may represent reduced exudation, evolving atrophy, or both. CATT documented geographic atrophy during treatment and associations with several baseline and treatment-related factors. Such findings do not mean that clinically active neovascularization should be left untreated to preserve thickness. They support documenting atrophy separately and recognizing that an anatomical outcome can become less favorable even while leakage is controlled. [48]
Polypoidal choroidal vasculopathy can produce PEDs, subretinal fluid, and hemorrhage. CST helps monitor consequences of exudation but does not show whether aneurysmal lesions have closed. EVEREST II evaluated ranibizumab with or without verteporfin photodynamic therapy using lesion and functional outcomes. Appropriate multimodal imaging, including indocyanine green angiography when indicated, remains necessary to characterize disease that a central thickness map cannot resolve. [51]
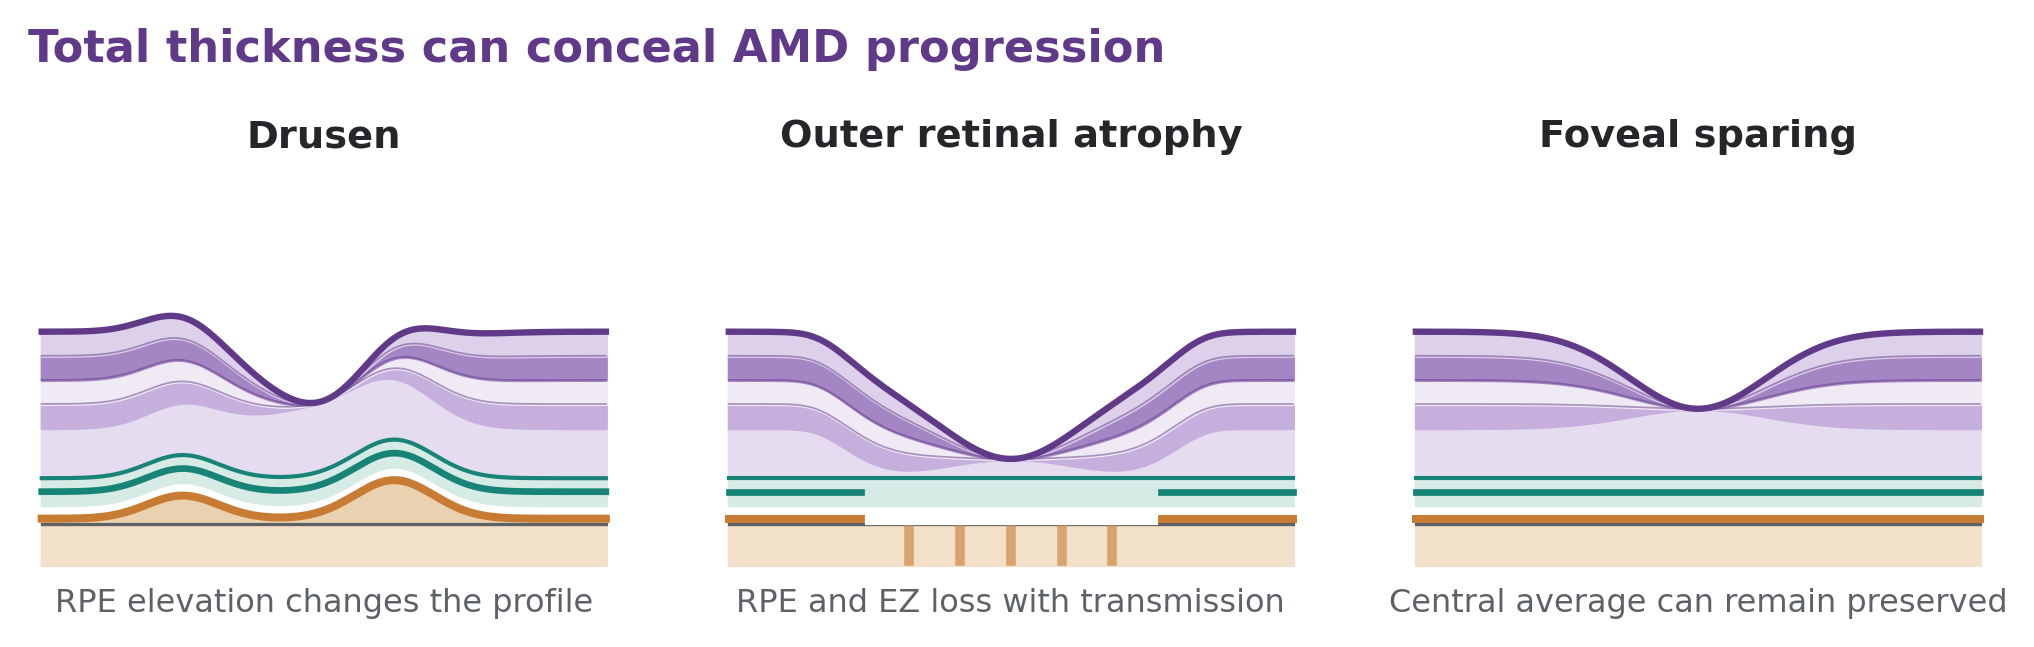
In nonneovascular AMD, drusen and other deposits can elevate the RPE and alter outer retinal architecture, while photoreceptor degeneration can reduce tissue thickness. These effects can coexist and partially offset each other in the total measurement. A stable CST therefore does not establish stable AMD. It may conceal enlargement of an atrophic area, increasing EZ loss, or progression near a still-spared foveal center. [52]
The Classification of Atrophy Meetings criteria for complete RPE and outer retinal atrophy (cRORA) use a region of choroidal hypertransmission and RPE attenuation or disruption measuring at least 250 µm, together with overlying photoreceptor degeneration and exclusion of an RPE tear as the explanation. These are spatial and morphologic criteria. They are not equivalent to a CST below 250 µm. Confusing the two creates a diagnostic category error: one measures lesion extent, the other average axial thickness. [52]
Geographic atrophy monitoring is better organized around lesion area, growth, proximity to or involvement of the fovea, and functional consequences. Fundus autofluorescence and OCT provide complementary information. Foveal sparing may preserve letter acuity while reading performance and parafoveal sensitivity worsen. CST can remain relatively stable until the lesion involves the central circle, and even then it does not capture the entire disease burden.
The pivotal OAKS/DERBY and GATHER2 studies evaluated treatments intended to slow atrophy enlargement. Their structural endpoints were atrophy-related, rather than normalization of central retinal thickness. In OAKS/DERBY, reduced lesion growth was not accompanied by differences in the key secondary visual-function endpoints at 24 months. These trials illustrate the broader distinction between a useful structural endpoint and a complete description of patient benefit. Treatment counseling must address expected slowing, ongoing monitoring, and risks, without presenting a thicker macula as the therapeutic objective. [53, 54]
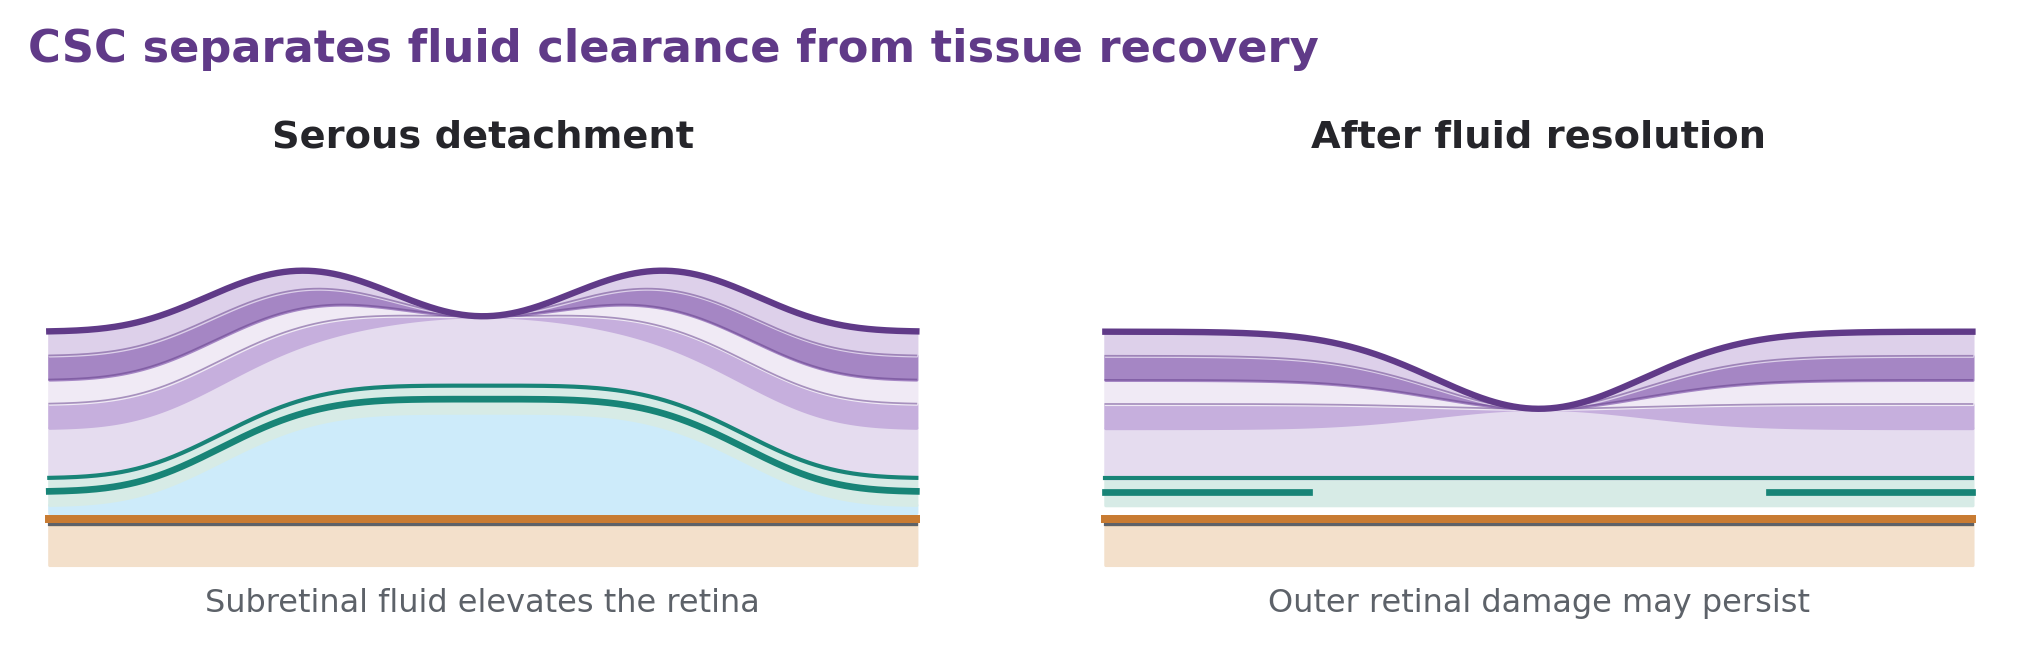
Central serous chorioretinopathy (CSC) usually produces a serous detachment of the neurosensory retina, often with RPE abnormalities or a PED. Depending on the segmentation convention, an increased central measurement can largely reflect the fluid gap beneath the retina. The neurosensory retina itself may be relatively preserved, or may already show outer retinal attenuation from chronic disease. Separately measure and describe subretinal fluid, retinal integrity, and choroidal features. [55, 56]
CST is not a surrogate for choroidal thickness, choroidal vascular hyperpermeability, or RPE pump function. A reduction after fluid resolution does not by itself establish complete functional recovery. Persistent EZ disruption, outer nuclear layer loss, RPE damage, metamorphopsia, reduced contrast, or altered retinal sensitivity can remain. Chronicity and recurrence matter, and an apparently favorable central number may coexist with damage outside the subfield.
The PLACE trial found superior subretinal-fluid resolution with half-dose photodynamic therapy compared with its high-density subthreshold micropulse laser protocol in chronic CSC. VICI found that eplerenone was not superior to placebo for the principal visual-acuity outcome in its chronic CSC population. Together, these trials demonstrate why treatment claims must be tied to the intervention, study population, and specific endpoint. A small uncontrolled fall in thickness does not establish treatment efficacy in a disease that can fluctuate or resolve spontaneously. [55, 56]
Pachychoroid-associated neovascularization can complicate this picture. Persistent or recurrent fluid may require evaluation for a neovascular component instead of assuming uncomplicated CSC. Medication history, including corticosteroid exposure, and multimodal imaging contribute to the differential. The clinical assessment should explain why fluid is present, rather than treating an elevated CST as the diagnosis.
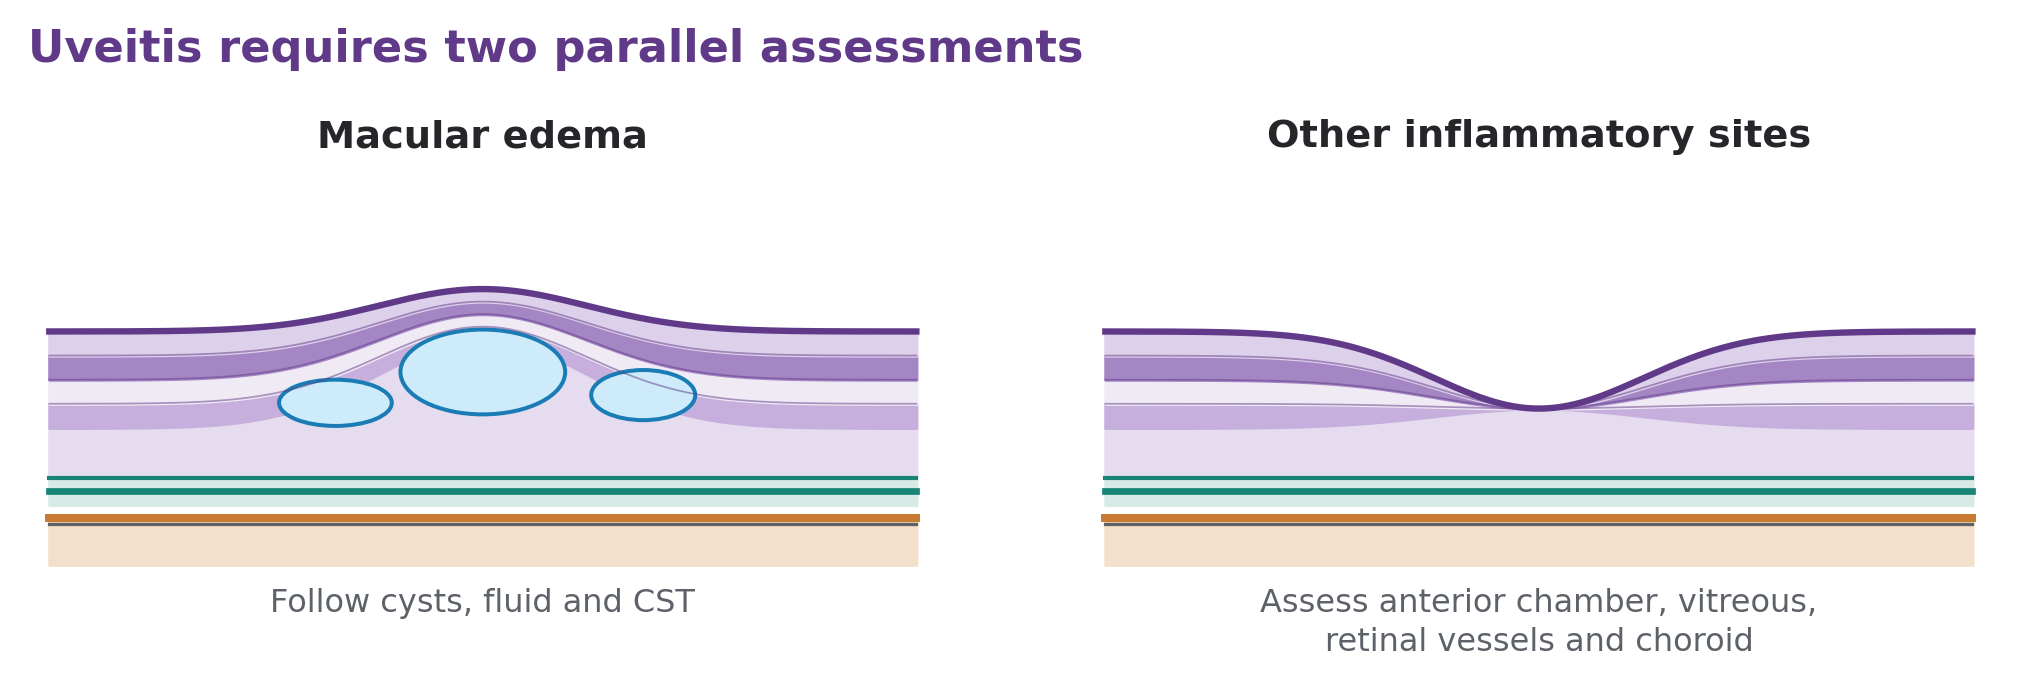
In uveitis, macular edema can result from inflammatory vascular permeability, with diffuse thickening, cystoid spaces, and sometimes subretinal fluid. CST provides a reproducible anatomical endpoint when scan quality and segmentation are adequate. It is especially useful for following recurrent edema and comparing response over time. However, anterior chamber activity, vitreous haze, retinal vasculitis, choroidal inflammation, and macular edema may evolve differently. CST is not a global index of uveitis activity. [4, 57]
The POINT trial compared periocular triamcinolone, intravitreal triamcinolone, and intravitreal dexamethasone implant. At eight weeks, mean proportional CST reductions were approximately 23%, 39%, and 46%, respectively. The intravitreal approaches were more effective for edema, with increased IOP risk requiring consideration. PEACHTREE demonstrated functional and anatomical benefit from suprachoroidal triamcinolone in noninfectious uveitic macular edema. These results are specific to their populations and routes of delivery. [4, 57]
MERIT compared dexamethasone implant, ranibizumab, and intravitreal methotrexate for persistent or recurrent uveitic edema. Its findings favored dexamethasone for edema reduction and vision improvement at the primary assessment, with subsequent follow-up providing information on retreatment. The 24-week report also illustrates a useful principle: cystoid spaces can justify recognizing persistent edema even when total CST lies within a nominal normal range. [58, 59]
In infectious retinitis, inflammatory chorioretinal lesions, and white dot syndromes, a small central thickness change may understate clinically important focal injury. APMPPE or other outer retinal/RPE disorders may primarily affect reflectivity and photoreceptor integrity. Vogt–Koyanagi–Harada disease can produce multifocal serous detachments and marked choroidal abnormalities. These conditions require etiologic diagnosis and lesion-based monitoring; a central average is only an adjunct. An inflammatory or infectious diagnosis should not be inferred from the height of the thickness peak.
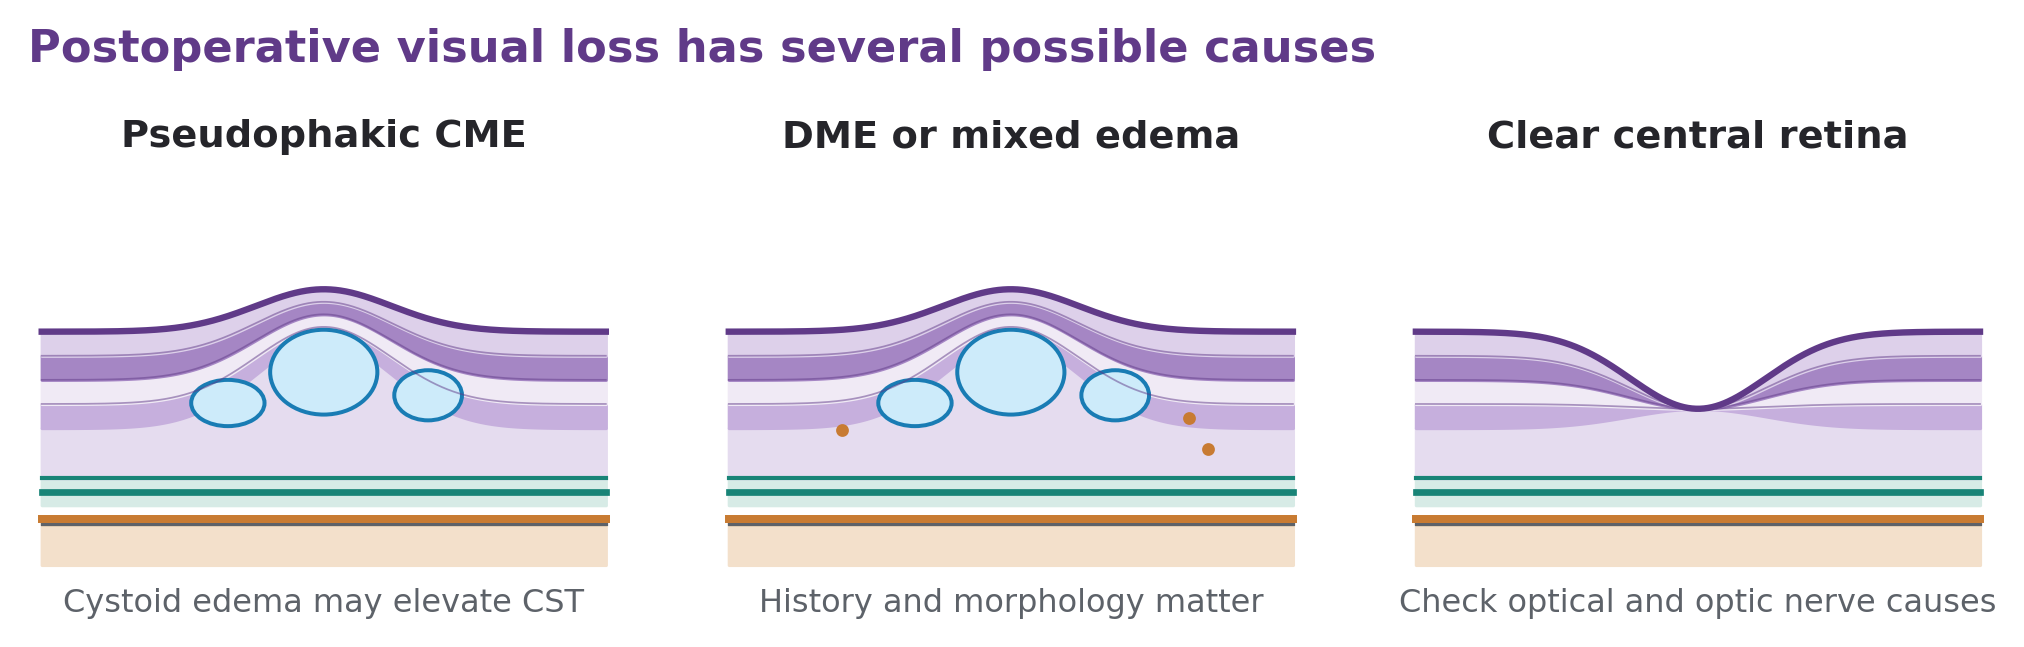
After cataract surgery, mild subclinical thickening and clinically significant pseudophakic cystoid macular edema (PCME) are distinct findings. A statistically measurable increase does not necessarily explain the patient's symptoms. The assessment should combine postoperative timing, acuity, inflammation, cystoid morphology, and the preoperative OCT. Retained lens material, vitreomacular interface disease, diabetes, vein occlusion, and other retinal pathology can alter both risk and interpretation. [60, 61]
The large database study by Chu and colleagues, involving 81,984 eyes, identified important ocular risk factors for postoperative macular edema. OCT pattern research also showed that PCME and DME can often be distinguished by the distribution of cysts and accompanying features, although mixed disease occurs. A high CST alone cannot make that distinction. In a diabetic patient after surgery, the cause may be PCME, DME, or both. [60, 61]
Cataract, corneal edema, dry eye, keratoconus, and corneal dystrophy can impair vision without producing primary macular thickening. These disorders also may degrade OCT signal or fixation. Consequently, a normal CST does not exclude an anterior-segment explanation for reduced vision, and an unreliable scan should not be interpreted as evidence of retinal change. For these conditions, CST is chiefly useful for identifying coexisting macular disease and evaluating postoperative complaints, rather than for grading the primary corneal or lenticular disorder.
After surgery, compare the underlying B-scans and image quality, not just the new numerical value. Improved media clarity can change automated segmentation or sampling performance. If CST falls while vision remains poor, assess residual edema, photoreceptor integrity, refractive error, ocular surface disease, posterior capsule opacity, and optic nerve pathology as appropriate. A single favorable macular measurement cannot account for every limitation in postoperative vision.
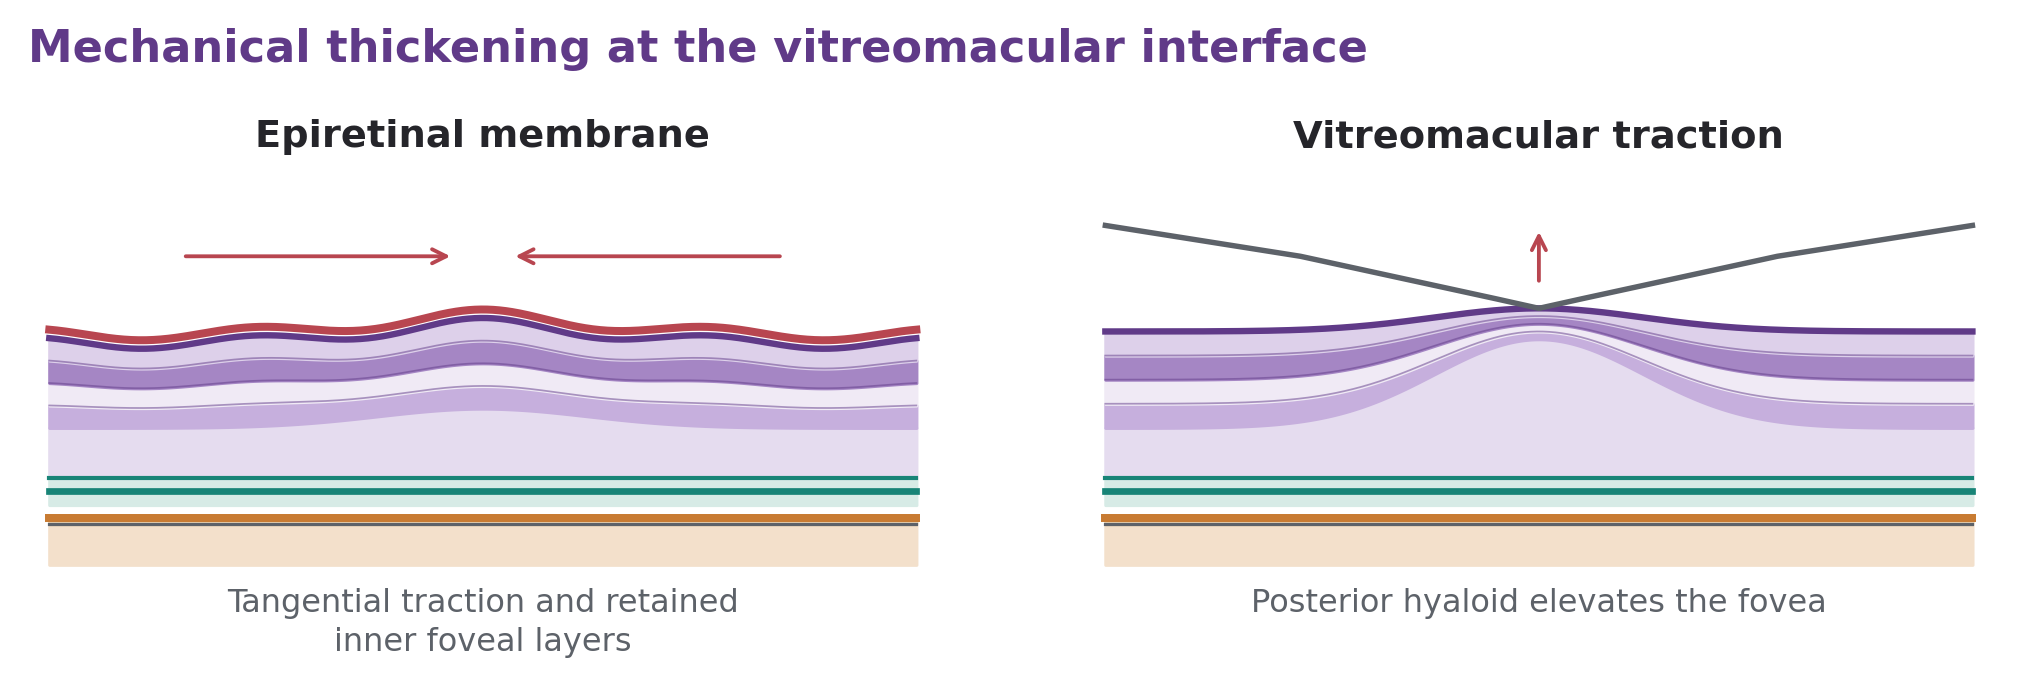
Epiretinal membrane (ERM) produces tangential traction, altered foveal contour, retinal thickening, and sometimes intraretinal splitting or cystic change. CST is useful for documenting the degree and progression of distortion, but it does not distinguish mechanical thickening from leakage. More discriminating features include the foveal pit, ectopic inner foveal layers, DRIL, EZ integrity, and associated traction. Symptoms such as metamorphopsia and impaired binocular function may be disproportionate to the total thickness. [14]
Govetto and colleagues described an OCT staging system in which continuous ectopic inner foveal layers and increasing architectural disruption were associated with poorer visual acuity. The study supports evaluating how the retina is organized, rather than considering all thick ERMs equivalent. Two eyes with similar CST can have different symptom burden and postoperative potential because their outer retinal integrity and inner-layer organization differ. [14]
Vitreomacular adhesion describes persistent attachment without distortion; vitreomacular traction (VMT) requires associated anatomical disturbance. VMT can elevate the fovea and produce pseudocysts, schisis, or subretinal fluid. OCT should identify the posterior hyaloid, attachment width, direction of traction, and coexisting macular hole. The IVTS classification uses attachment geometry and morphology, rather than CST alone, to distinguish these entities. [5]
Surgical decisions incorporate symptoms, progression, visual function, fellow-eye status, cataract, and expected benefit. There is no universal CST threshold that independently mandates ERM peeling or VMT intervention. After release of traction, thickness can fall gradually while metamorphopsia persists. Conversely, useful functional improvement may occur before complete contour normalization. The postoperative report should document residual traction, layer recovery, and new edema separately.
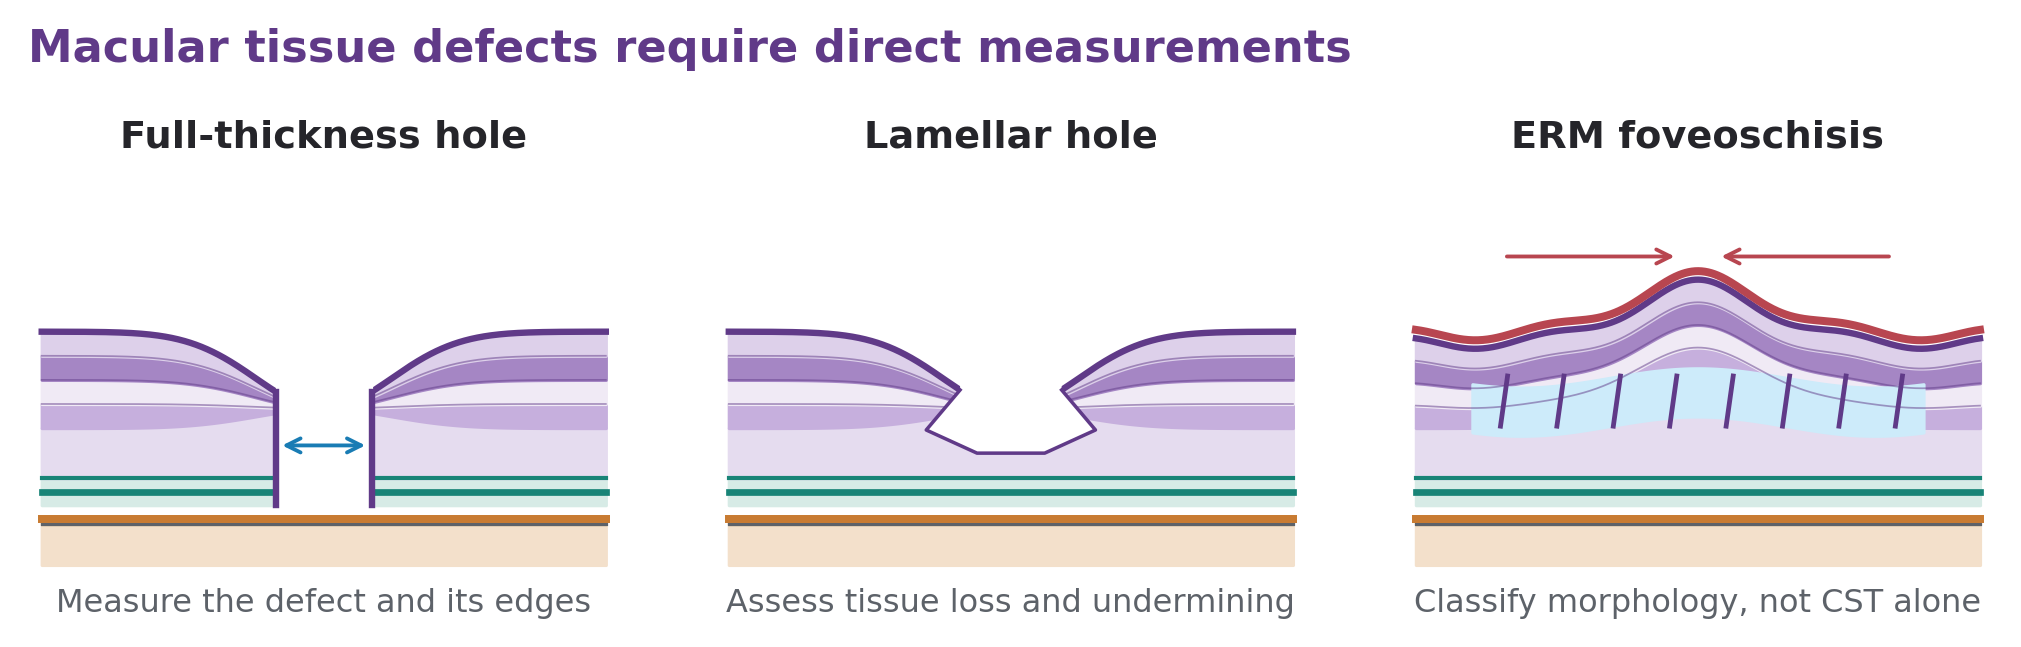
A full-thickness macular hole interrupts the neurosensory retina at the fovea. Averaging thickness across the central circle can combine the tissue defect with elevated cystic edges, generating a value that is low, high, or algorithmically unreliable. The minimum hole diameter, base diameter, vitreomacular relationship, outer retinal condition, and closure configuration are more directly relevant than CST. Manual assessment is essential when automated segmentation bridges or misidentifies the defect. [5]
Lamellar macular hole, ERM foveoschisis, and macular pseudohole should also be separated. The consensus definition of lamellar macular hole requires an irregular foveal contour, a cavity with undermined edges, and apparent loss of foveal tissue. ERM foveoschisis is characterized by an ERM and schisis at the Henle fiber layer, while a pseudohole reflects a different tractional configuration. These structural distinctions cannot be recovered from a single average thickness. [62]
After successful hole closure, a very thin center is not necessarily evidence of treatment failure, and a thicker closed center is not necessarily evidence of superior recovery. ELM and EZ reconstitution, residual outer retinal defects, acuity, and symptoms should be assessed longitudinally. The purpose of CST is supplementary documentation; the anatomical endpoint is closure and restoration of clinically meaningful structure.
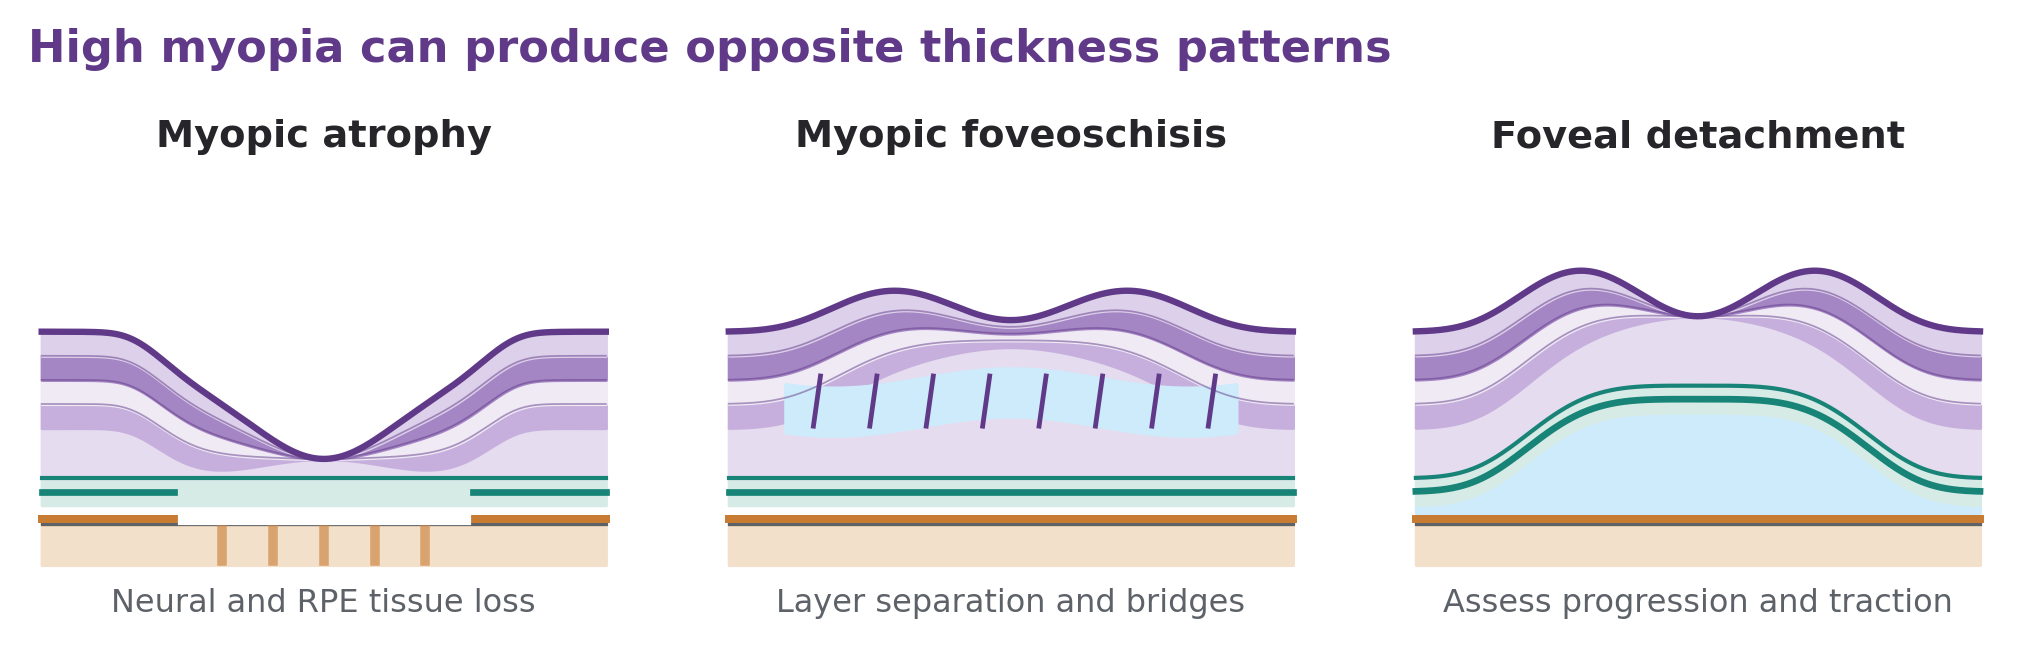
High myopia can combine axial elongation, posterior staphyloma, chorioretinal atrophy, neovascularization, and tractional splitting. The statement that “myopia makes the central retina thin” is therefore incomplete. An eye with outer retinal atrophy may have a low CST, whereas the same refractive category can contain a very thick retina because of myopic foveoschisis or foveal detachment. Central and peripheral macular changes need not follow the same direction. [21, 22]
Myopic foveoschisis produces separation within retinal layers, often with bridging columns. Its increased thickness should not be equated with VEGF-driven edema. Serial imaging should assess the extent of schisis, tractional elements, foveal detachment, lamellar or full-thickness hole formation, and progression. Longitudinal observational work found that some eyes remain stable, whereas combinations of premacular traction and foveal detachment carry different risks. [21]
Magnification correction, wide enough scan coverage, and careful segmentation are especially important in these eyes. A small apparent change may reflect sampling a different part of the staphyloma. If myopic neovascularization develops, fluid may be limited and the CST increase modest; new symptoms, hemorrhage, and focal outer retinal changes can be more informative. Neither normal CST nor a thin choroid excludes active myopic macular pathology.
In retinitis pigmentosa (RP), rod–cone dystrophy, and related inherited conditions, peripheral or parafoveal photoreceptor loss can progress while CST remains relatively preserved. A small surviving foveal island can support central acuity despite severe field constriction. Conversely, cystoid macular edema may increase CST in an eye that is simultaneously losing outer retinal tissue. A total-thickness trend alone cannot distinguish these competing processes. [63, 64]
EZ width or area, outer nuclear layer thickness, autofluorescence patterns, visual fields, electroretinography, and microperimetry address different aspects of progression. Studies of EZ measurement repeatability support its use as a disease-specific structural endpoint, provided the measurement method and quality are controlled. The width of a preserved EZ is not identical to the total functioning field, but it is often more relevant to photoreceptor preservation than central full-retinal thickness. [63]
Small studies of topical dorzolamide for RP-associated edema reported anatomical responses in some patients. These studies should be interpreted according to their sample size, design, and functional findings. A CST reduction after edema therapy is evidence of an anatomical response; it does not establish that the inherited degeneration has stopped or that lost photoreceptors have regenerated. Rebound edema and variable response also make serial assessment important. [64]
Stargardt disease and cone–rod dystrophies may cause central or parafoveal outer retinal loss, producing reduced CST as disease advances. Foveal sparing can preserve the central measurement despite an expanding surrounding lesion. The 2024 ProgStar OCT report evaluated 428 eyes of 236 patients over 24 months and detected progressive loss in individual outer retinal layers. Inner retinal thickness could behave differently, illustrating why total thickness may obscure layer-specific degeneration. [29]
The practical monitoring set includes outer retinal integrity, intact layer area, autofluorescence lesion extent, retinal sensitivity, fixation, and patient-reported difficulty. CST adds a useful summary but should not be used alone as a natural-history endpoint or a claimed treatment response. In genotype-specific trials, the most suitable measure depends on the phenotype, stage, residual tissue, and expected mechanism of the intervention.
X-linked retinoschisis can produce a dramatically increased central thickness from retinal splitting. Schisis cavities are not equivalent to vascular leakage. A small early dorzolamide series reported reduced foveal thickening in several patients, sometimes with visual improvement, but the uncontrolled design limits estimates of treatment effect. Shrinking schisis spaces does not necessarily restore normal neural organization, and later thinning can reflect atrophy rather than uncomplicated improvement. [65]
Best vitelliform macular dystrophy and adult-onset vitelliform patterns introduce a different problem: subretinal material and stage-dependent fluid-like spaces can alter the total measurement. OCT biomarkers and retinal sensitivity studies in Best disease support evaluating lesion composition and photoreceptor integrity. New neovascularization requires a separate assessment. A high central number does not prove exudative AMD, and the evolution of a vitelliform deposit should not be interpreted solely through an edema algorithm. [66]
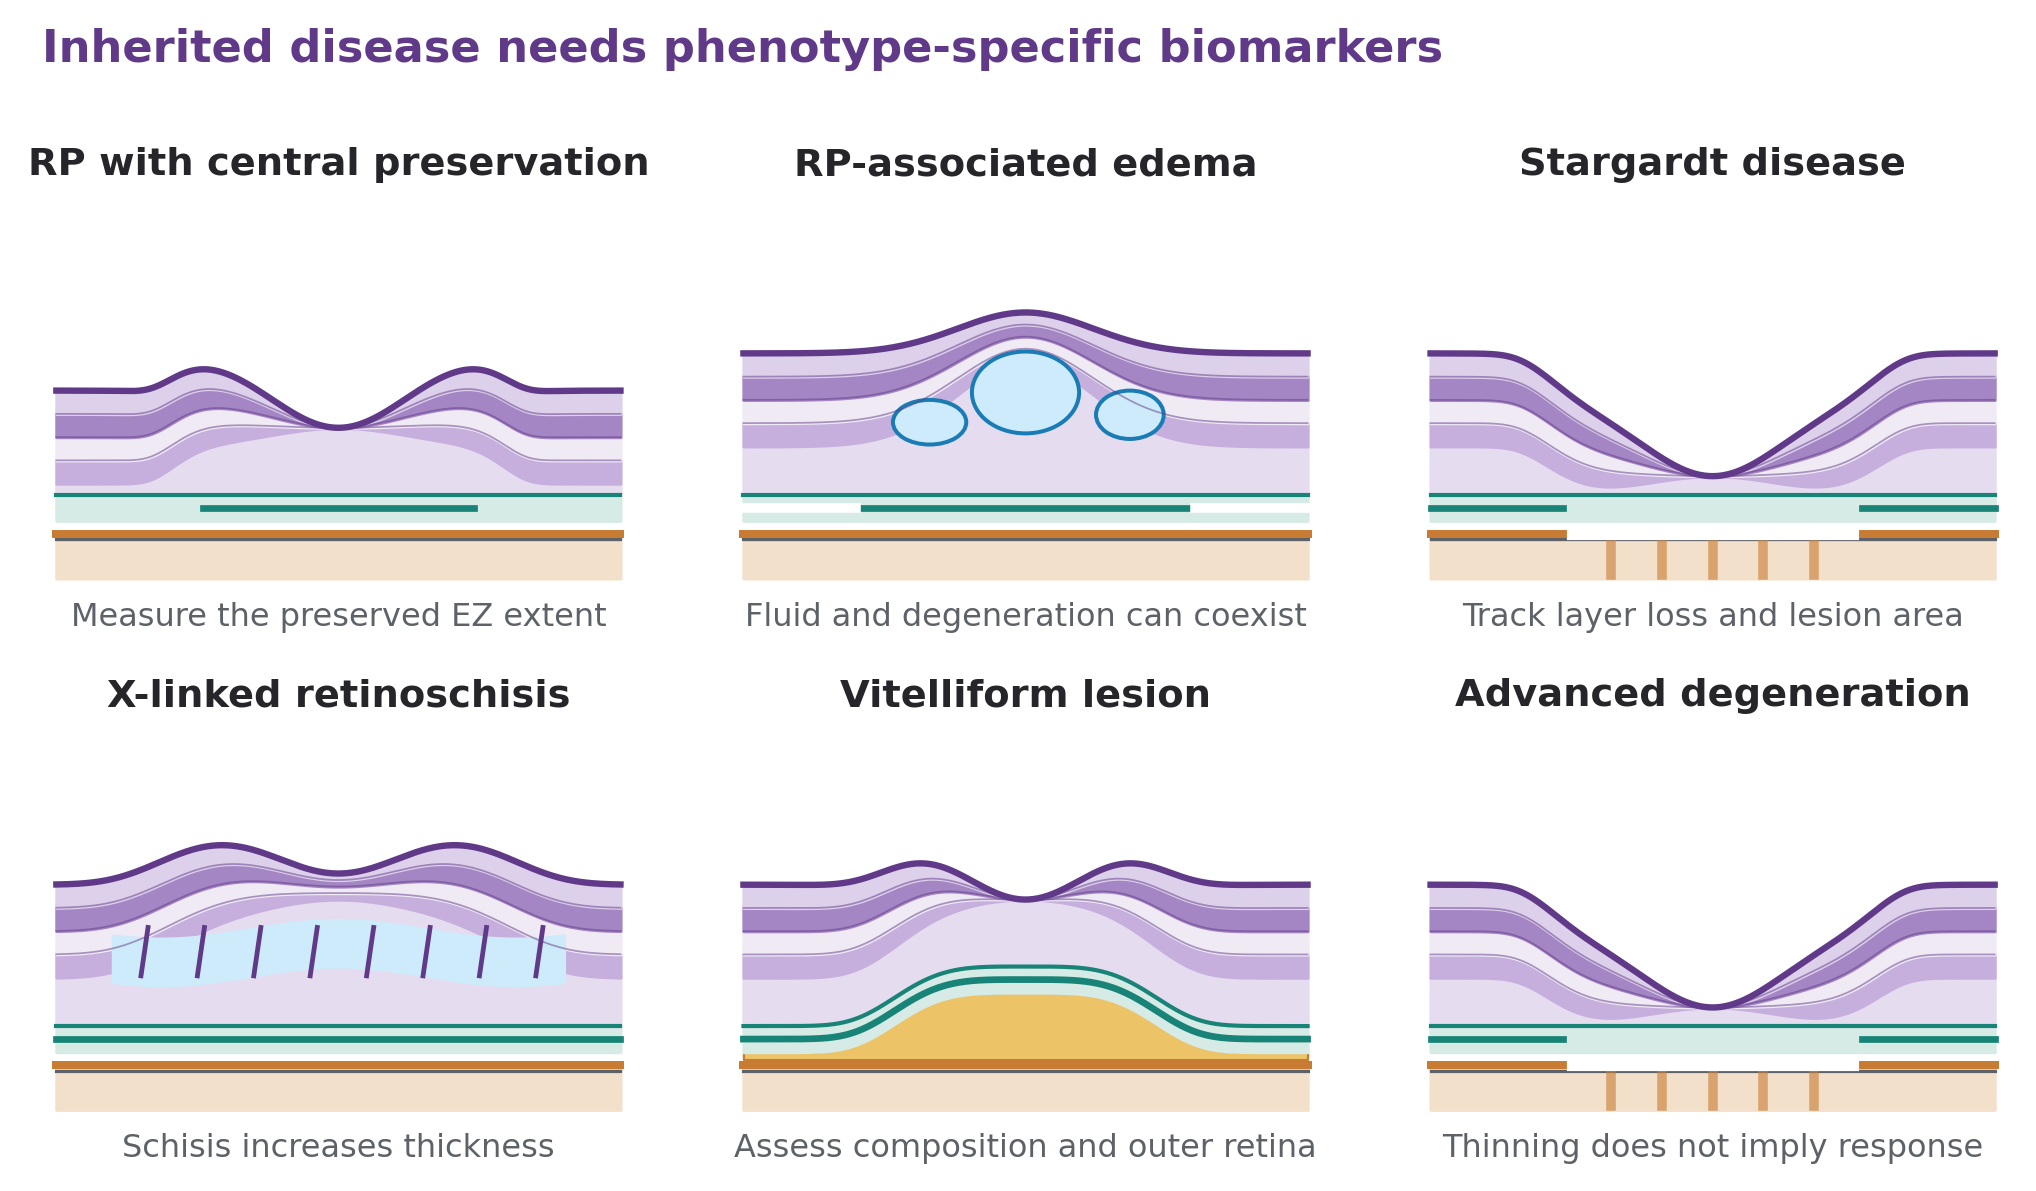
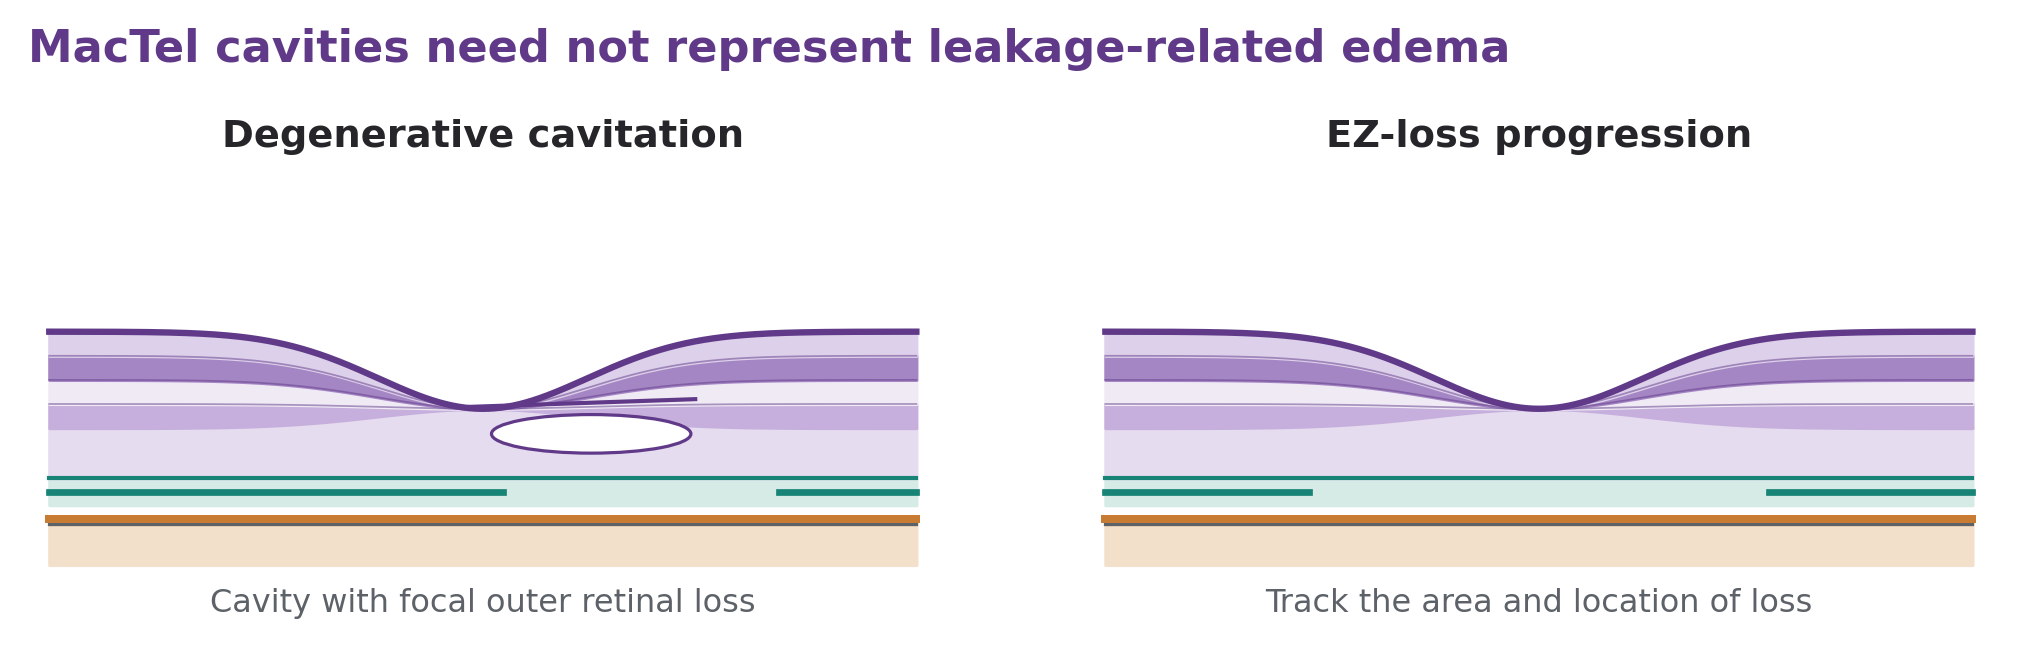
Macular telangiectasia type 2 (MacTel) is a particularly important example of the limitations of CST. Inner and outer retinal cavities may coexist with normal or reduced total thickness. These spaces often reflect tissue loss and structural degeneration rather than ordinary leakage-related cystoid edema. Temporal parafoveal involvement, an ILM drape, and EZ loss can provide more information than the central mean. Angiographic leakage does not imply that every cavity should be treated as DME-like swelling. [19]
The functional consequence depends on photoreceptor loss and its location, including whether the foveal center is involved. Reading difficulty and localized sensitivity loss can be important even when high-contrast acuity is relatively preserved. Follow-up should therefore document EZ-loss area, cavitation pattern, retinal sensitivity when available, and evidence of a neovascular complication. Neovascular MacTel requires a separate activity assessment from nonneovascular degeneration.
The phase 2 CNTF study and the 2025 phase 3 trials of encapsulated cell therapy used EZ-area loss as a central structural endpoint. The phase 3 trials showed significantly slower expansion of EZ loss with treatment, while functional findings varied across measures and trials. This is a clear example of selecting a biomarker that matches the pathology: preservation of photoreceptor-associated structure is more relevant than achieving a lower CST in a disease characterized by cavitation and degeneration. [67, 26]
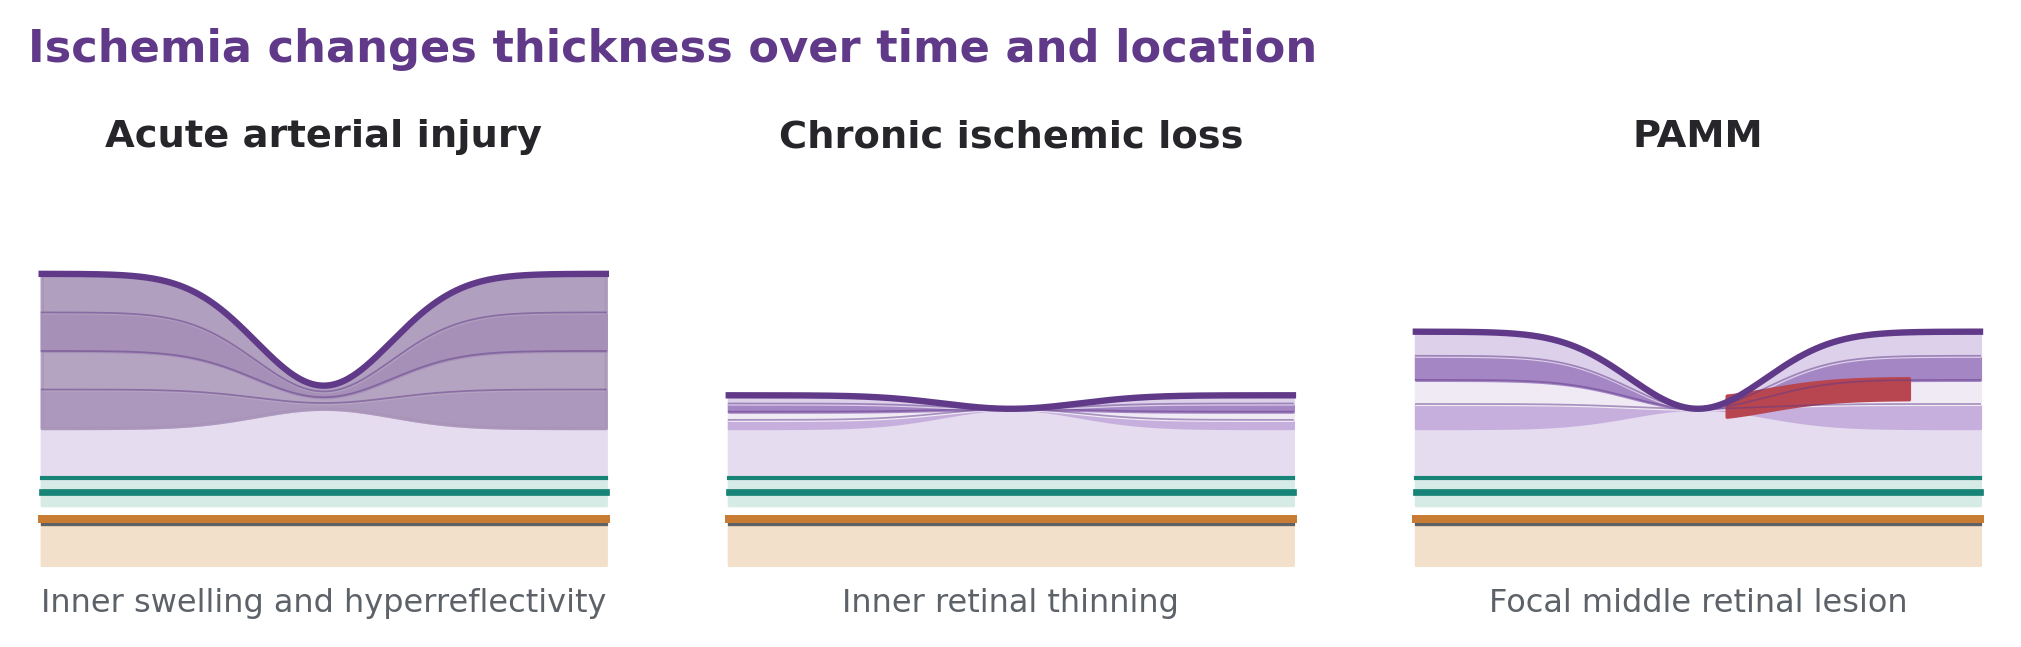
Acute central or branch retinal artery occlusion can cause swelling and hyperreflectivity of the inner retina. With time, injured layers may become thin and atrophic. CST therefore can reverse direction over the disease course: acute thickening followed by chronic thinning. The foveal avascular anatomy and the distribution of the occlusion influence whether the central average changes substantially. A near-normal CST cannot exclude profound retinal ischemia. [68, 69]
Paracentral acute middle maculopathy (PAMM) typically shows a hyperreflective band centered in the middle retina acutely, followed by localized thinning, often involving the inner nuclear layer. Acute macular neuroretinopathy involves a different outer retinal pattern. Lesions may be small, parafoveal, and clinically important despite little effect on the central average. Correlate the B-scan and en face abnormalities with the patient's scotoma and assess the relevant vascular or systemic setting. [69]
Anatomical improvement in swelling after an arterial event does not demonstrate recovery of perfusion or neural survival. Serial assessment should distinguish reduced hyperreflectivity, restored layer definition, and evolving tissue loss. Thickness data also cannot determine the onset time or treatment eligibility for acute ischemia with sufficient reliability to replace a clinical history and emergency evaluation.
Suspected acute retinal arterial occlusion requires urgent emergency/stroke evaluation according to the clinical presentation and local pathways. The American Heart Association scientific statement classifies acute CRAO as a medical emergency. Obtaining or repeating a CST measurement must not delay that evaluation. New flashes, a curtain-like field defect, acute severe visual loss, or a painful postoperative eye likewise require syndrome-specific urgent assessment rather than reassurance from a central thickness value. [70]
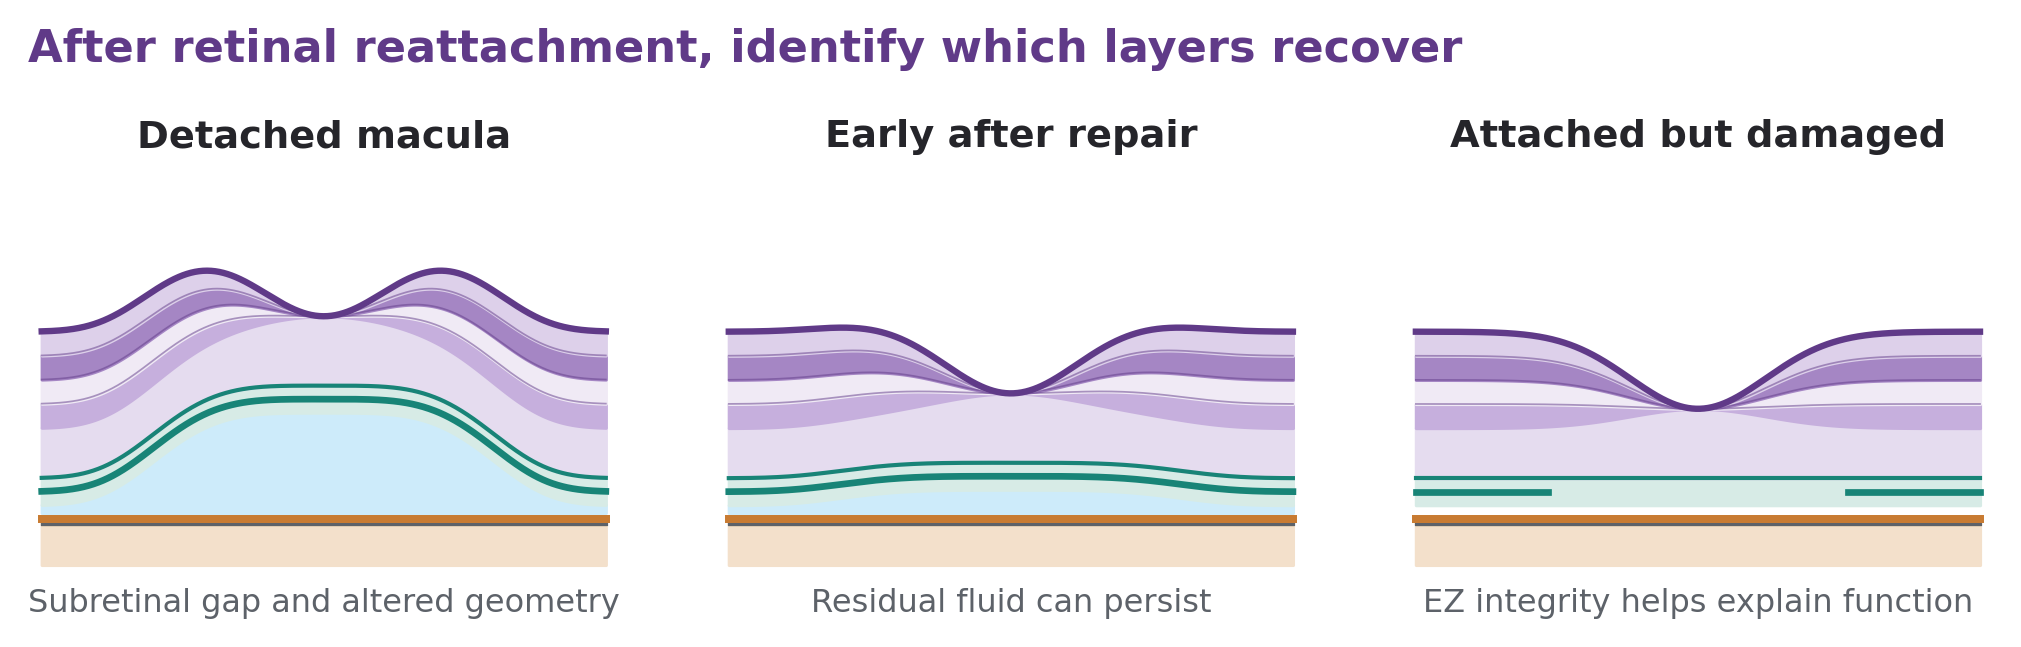
In macula-off rhegmatogenous retinal detachment, separation of the neurosensory retina from the RPE makes a routine central thickness summary difficult to interpret. A software output may span the subretinal gap or fail to follow the detached tissue correctly. Record the detachment configuration, foveal status, intraretinal changes, and outer retinal condition rather than assigning prognostic meaning to an unverified CST. Tractional and exudative detachments introduce related but etiologically different problems. [28]
After successful reattachment, residual subretinal fluid, cystoid edema, an ERM, and photoreceptor disruption can each affect the central measurement. Serially registered OCT studies have documented progressive restoration of outer retinal bands and increases in selected outer retinal thicknesses during recovery. Thus, an increase in a particular layer after repair can be consistent with structural recovery rather than recurrent edema. The total CST must be decomposed into the structures that changed. [28]
Visual recovery is not guaranteed by anatomical attachment or a normalized thickness map. The duration and extent of detachment, preoperative function, photoreceptor integrity, and postoperative complications all contribute. The clinical report should separately state attachment status, residual fluid, layer integrity, and measured visual function, allowing a favorable change in one domain to coexist with a limitation in another.
Full-retinal CST is not a primary glaucoma biomarker. Glaucoma damages retinal ganglion cells and their axons, while central total thickness includes substantial outer retinal tissue. The normal foveal displacement of ganglion cells further reduces the sensitivity of a central 1-mm average. Dedicated GCIPL or GCC analysis, peripapillary retinal nerve fiber layer measurement, optic disc assessment, and appropriately sampled visual fields provide a more relevant structure–function framework. [71, 10]
Research comparing macular GCC analysis with total macular thickness demonstrated improved diagnostic performance from isolating the ganglion cell-containing layers. This does not eliminate the need to inspect segmentation. ERM, high myopia, edema, retinal degeneration, and prior surgery can alter macular layer measurements and create false glaucomatous patterns or conceal genuine loss. A concurrent increase in full retinal thickness can coexist with progressive ganglion cell damage. [71]
Similar principles apply to optic neuritis, nonarteritic anterior ischemic optic neuropathy, hereditary optic atrophy, and compressive optic neuropathy. Their main structural changes are not adequately summarized by CST. Disease-specific optic nerve and ganglion cell assessment, visual fields, color vision, pupillary examination, and other indicated investigations remain necessary. A normal macular thickness does not exclude a serious afferent visual pathway disorder.
Inner nuclear layer microcystic changes have been described in eyes with optic neuropathy, including multiple sclerosis-associated disease. The original observational report linked such changes with disability and prior optic neuritis, but the appearance is not a diagnosis of multiple sclerosis and does not automatically indicate ordinary VEGF-mediated edema. Distinguish the imaging phenotype from its mechanism, and avoid automatically interpreting small microcysts as an indication for intravitreal treatment. [72]
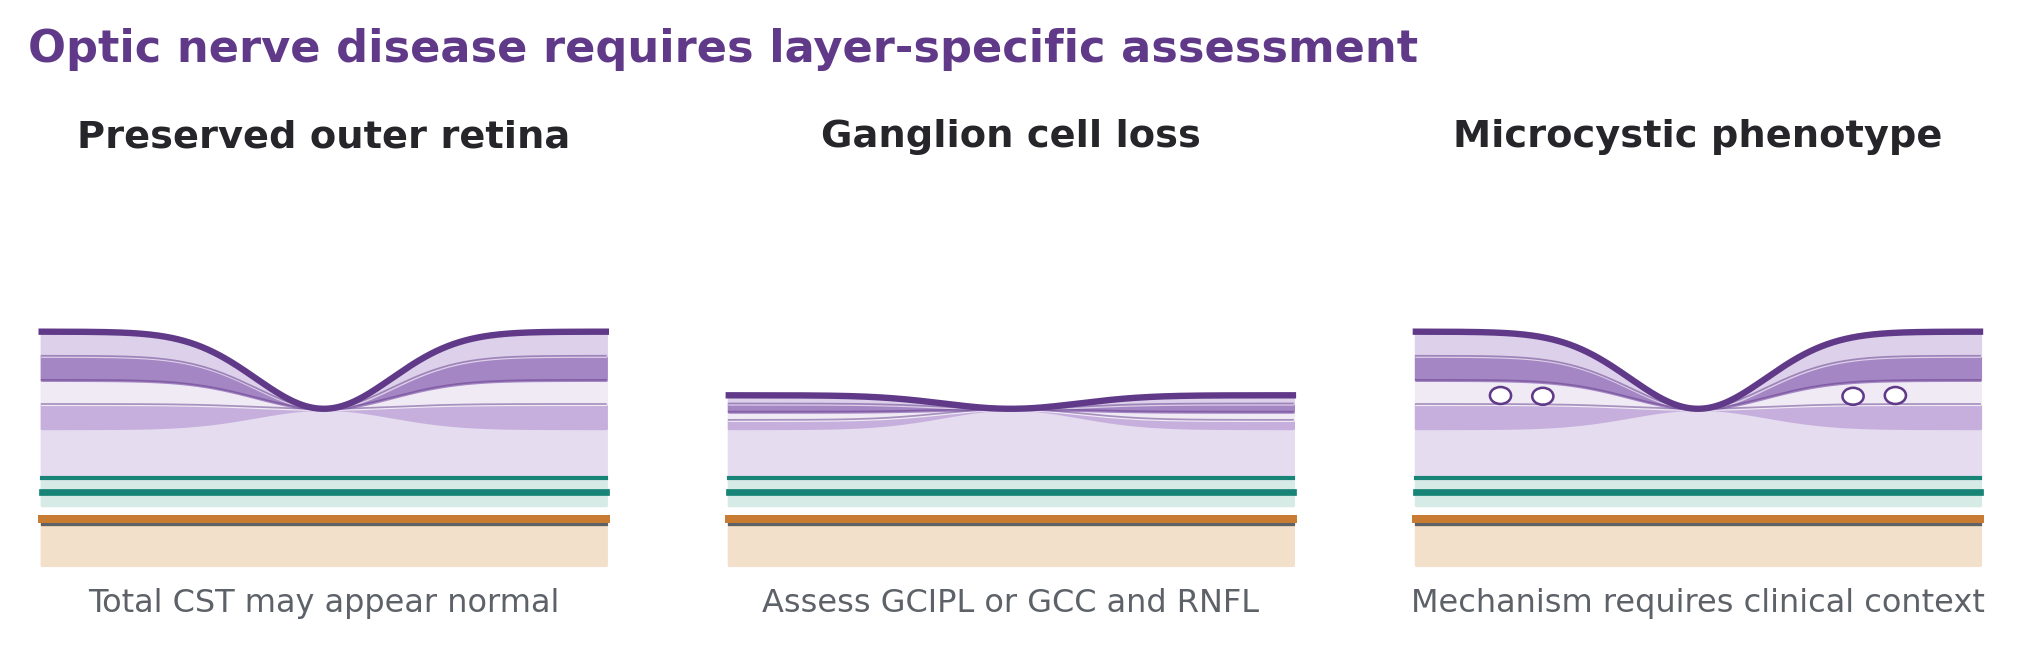
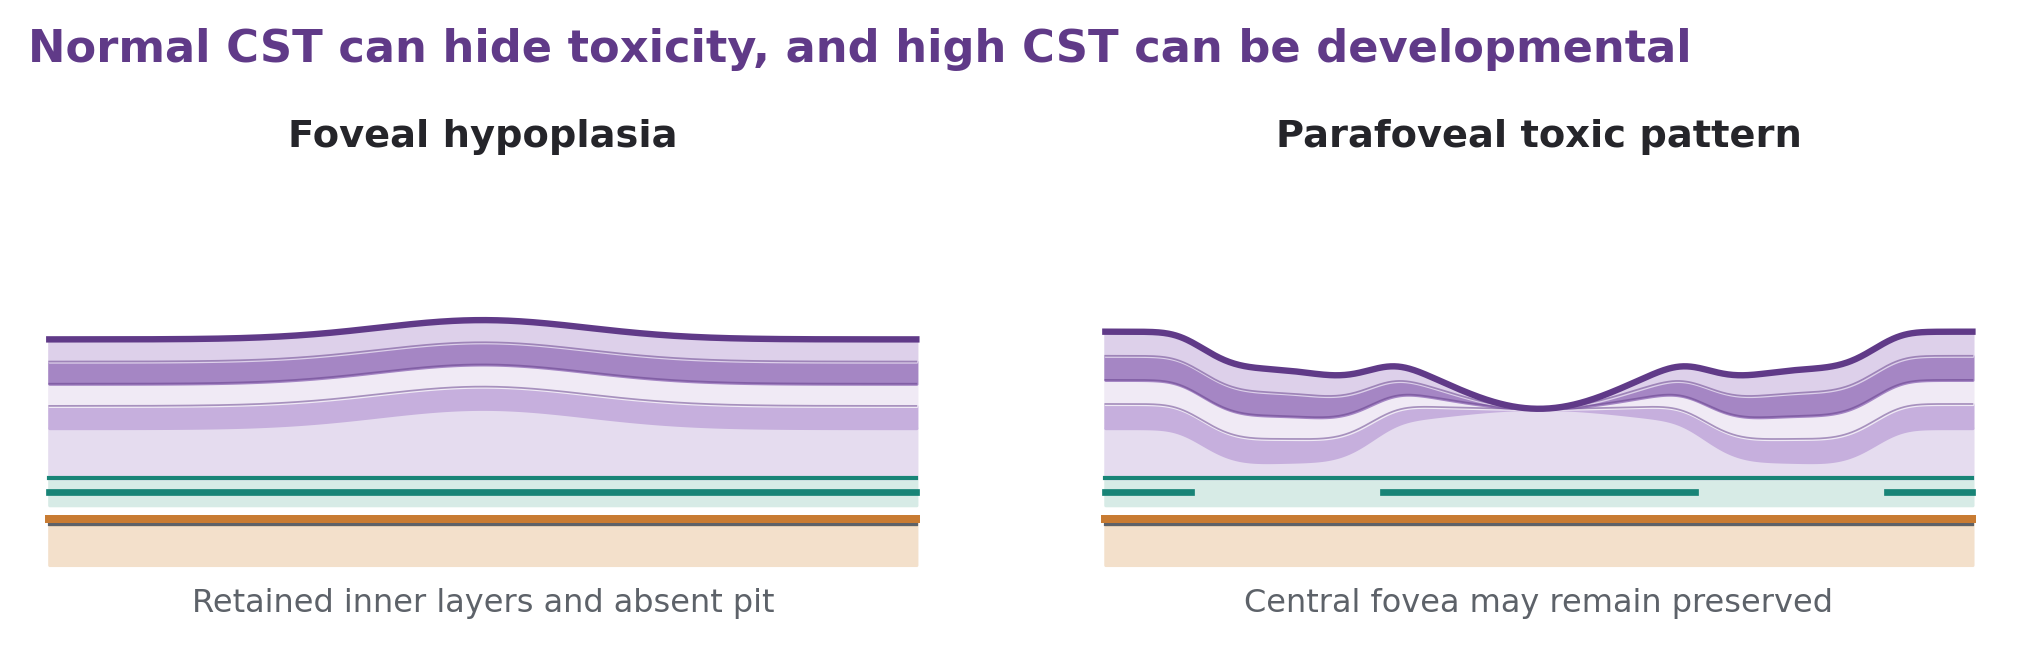
Foveal hypoplasia may occur with albinism, PAX6-related disease, other genetic conditions, or an isolated developmental phenotype. Retained inner layers and a shallow or absent pit can increase central thickness without leakage. The established OCT grading approach evaluates the pit, outer nuclear layer widening, and photoreceptor outer segment specialization. These features have a closer relationship to developmental architecture and visual potential than an isolated high CST. [13]
Children also require attention to age, cooperation, fixation, scan centering, and normative applicability. A thick central macula in a child should not automatically be labeled edema using an adult database. Nystagmus and atypical foveal anatomy can make automated centering particularly unreliable. The longitudinal question is whether the architecture is stable and developmentally consistent, or whether new pathological change has appeared.
Hydroxychloroquine toxicity usually requires examination of the distribution of outer retinal damage. Parafoveal or pericentral changes can develop while the central fovea and CST remain relatively preserved. The risk literature and the AAO 2025 revision of screening recommendations, published in its 2026 journal issue, support a screening strategy using appropriate structural and functional testing rather than a central thickness cutoff. OCT coverage must be sufficient to assess the pattern at risk. [73, 74]
Medication-associated maculopathies are heterogeneous. Some produce true edema; others cause deposits, cavitation, or outer retinal/RPE injury. Drug exposure, timing, lesion pattern, and alternative explanations therefore matter more than whether CST is above or below the normative mean. A suspicious result should be confirmed with the indicated complementary tests and coordinated with the prescribing clinician. An isolated machine color flag is insufficient evidence for a major systemic treatment change.
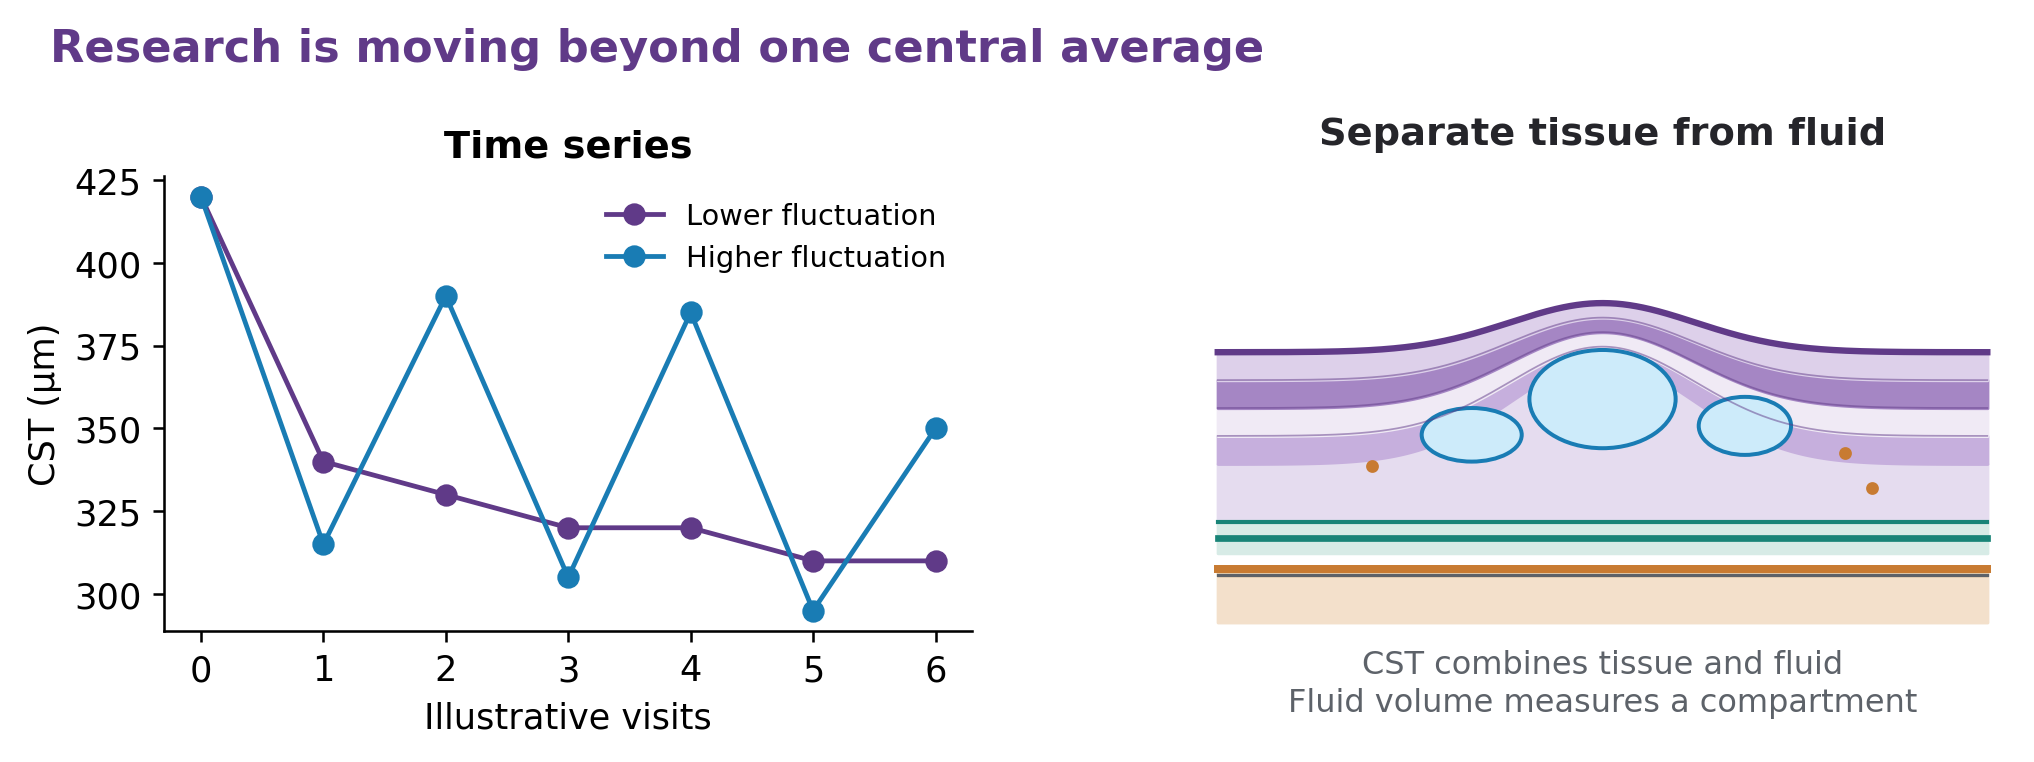
Several studies have examined visit-to-visit CST fluctuation as a marker of disease control and prognosis. A 2025 post hoc VIEW analysis found that the highest fluctuation quartile was associated with smaller visual gains at one year. A multicenter retrospective DME study, published online in 2025 and in a 2026 issue, also linked greater fluctuation with worse final vision in 499 eyes. These findings are clinically plausible, but they show association and do not establish that reducing a calculated standard deviation will independently improve vision. [75, 76]
The evidence is not uniform. Another DME study published online in September 2025 found that first-year thickness variability did not independently predict visual outcomes at three or five years after accounting for other factors. Its cohort sizes were 184 and 138 at those follow-up points. Different patient selection, observation periods, treatment patterns, baseline vision, and analytic methods can change the apparent relationship. [77]
Fluctuation statistics also depend on sampling. An eye imaged every month offers more opportunities to detect peaks than one imaged less frequently. Standard deviation may include the initial treatment-related fall, so a strong early response can inflate “variability.” Long gaps, missing visits, device changes, and segmentation errors can further distort estimates. CST variability is best treated as a prompt to examine disease control and follow-up history, not as a validated standalone indication to intensify treatment.
Automated fluid segmentation can quantify intraretinal and subretinal fluid separately, preserving information lost in total thickness. In a 215-eye diabetes study, central macular fluid volume showed higher diagnostic discrimination for center-involved DME than CST, with areas under the receiver operating characteristic curve of 0.907 and 0.832, respectively. This was a diagnostic study; it did not establish superiority for treatment selection or long-term visual prognosis. [31]
Quantitative tools introduce their own dependencies. A 2026 study of 401 DME eyes compared same-session scans with 97, 49, and 25 B-scans. Several automated biomarkers were relatively stable, but intraretinal fluid volume was more sensitive to reduced scan density. The lesson is practical: a numerical biomarker remains dependent on acquisition protocol, algorithm, and validation population, even when it is produced automatically. [78]
Layer-specific loss, EZ area, DRIL extent, fluid compartment volume, and atrophy area may complement CST, but they should be judged by repeatability and clinical usefulness. A prognostic marker estimates outcome risk; a predictive treatment-selection marker identifies differential benefit from one intervention versus another. Demonstrating the latter requires stronger evidence than a retrospective correlation. Device-independent validation and prospective impact studies remain necessary before complex algorithms become universal decision rules.
The 2026 Shahroud normative study and the 2026 axial-length correction study address different sources of variation: biological population differences and scan geometry. In the axial-length study, average correction effects were small, but the direction and magnitude of individual differences related to axial length. Neither paper supplies a single universally correct CST value. Together they reinforce standardized acquisition and careful interpretation near any operational threshold. [7, 22]
The current evidence therefore supports an expanded assessment rather than abandonment of CST. The number remains accessible and useful, particularly for edema monitoring. Its greatest value comes from pairing it with the specific pathology, verified imaging, and functional outcome, while recognizing when another biomarker better matches the clinical question.
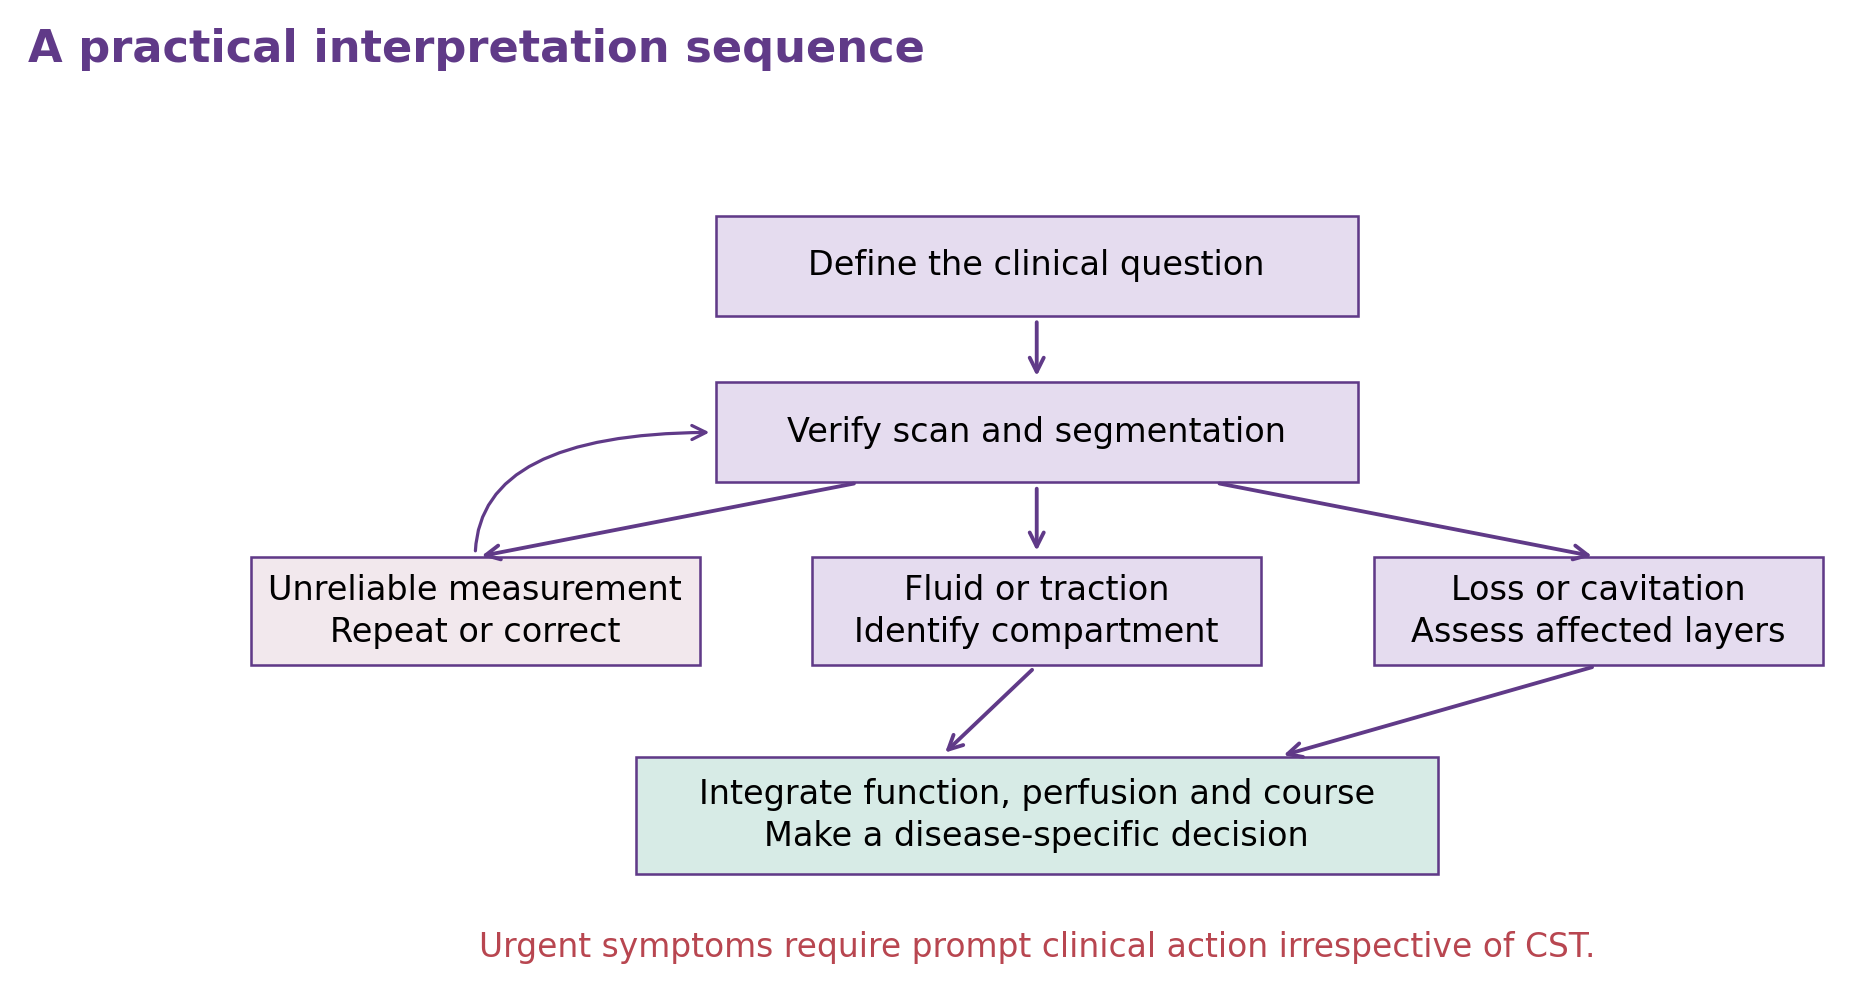
First establish whether the scan is being used to detect edema, monitor known disease, assess traction, investigate unexplained vision loss, or document atrophy. The same CST can have a different meaning in each setting. Confirm symptoms, BCVA, relevant treatment history, and time since the last intervention before interpreting change. A recently treated DME eye and an untreated eye with MacTel should not be assessed through the same numerical response rule.
Check the eye, date, device, scan protocol, registration, signal quality, central-subfield position, and segmentation boundaries. Review the full volume. If a new value would change management but the image is unreliable, repeat or correct the scan first when clinically appropriate. Where urgent pathology is suspected, measurement refinement should proceed alongside, rather than delay, the required clinical action.
Classify the dominant finding as diffuse thickening, intraretinal fluid, subretinal fluid, PED, traction, schisis, tissue defect, cavitation, or atrophy. Several may coexist. Describe central versus extracentral location and assess ELM/EZ integrity, inner retinal organization, hemorrhage, and other relevant findings. Obtain OCT angiography, fluorescein angiography, indocyanine green angiography, autofluorescence, fields, microperimetry, or electrophysiology when they answer a specific remaining question.
Record absolute CST and change from the prior comparable visit, rather than only a color category. State whether fluid has appeared, diminished, persisted, or redistributed. If vision and CST disagree, consider ischemia, atrophy, traction, chronic outer retinal damage, optical causes, and optic neuropathy. A discrepant result is an opportunity to refine the diagnosis; it is not automatically a failed scan or an unreliable patient response.
An illustrative report might read: “Right eye Spectralis macular volume scan, registered to the prior visit. Central subfield 372 µm, previously 428 µm, a reduction of 56 µm. Central intraretinal fluid has decreased but persists. No subretinal fluid. Focal EZ disruption is unchanged. Segmentation reviewed and acceptable. BCVA is unchanged at 20/50. Findings indicate partial anatomical response; functional limitation requires correlation with chronic outer retinal injury and perfusion status.”
For another eye, the appropriate interpretation could be: “CST is stable, but temporal parafoveal EZ loss has enlarged.” In a glaucoma patient, it could be: “Full-retinal CST is unchanged; inferior macular GCIPL loss and corresponding field progression require separate assessment.” Reporting the clinically important change prevents the central average from dominating the record.
| Clinical setting | Useful CST role | What must accompany it |
|---|---|---|
| DME and RVO edema | Quantify central swelling and response | BCVA, fluid pattern, ELM/EZ, DRIL, perfusion and peripheral disease |
| Neovascular AMD and PCV | Follow part of the exudative burden | Fluid compartments, hemorrhage, PED, lesion activity, scar and atrophy |
| Geographic atrophy | Describe central tissue loss | Lesion area, growth, foveal involvement and functional testing |
| CSC and pachychoroid | Follow central detachment consequences | SRF, outer retinal integrity, RPE and choroidal assessment |
| Uveitis and postoperative CME | Monitor edema and recurrence | Etiology, inflammatory activity, acuity and treatment risks |
| ERM and VMT | Document deformation and progression | Traction, foveal contour, ectopic layers, symptoms and EZ |
| Macular hole | Supplement structural assessment | Hole dimensions, tissue defect and closure morphology |
| Myopic traction and XLRS | Document schisis burden | Splitting pattern, traction, foveal detachment and atrophy |
| RP and Stargardt disease | Track edema or central thinning | EZ extent, layer loss, autofluorescence, fields and sensitivity |
| MacTel | Limited measure of central structure | Cavitation, EZ-loss area, sensitivity and neovascular complications |
| Arterial ischemia and PAMM | Follow swelling then tissue loss | Clinical urgency, layer distribution and vascular evaluation |
| Glaucoma and optic neuropathy | Detect coexisting macular disease | GCIPL/GCC, RNFL, optic nerve and visual fields |
| Foveal hypoplasia and toxicity | Contextual structural summary | Developmental architecture or distribution of outer retinal damage |
| Corneal and lens disease | Evaluate retinal comorbidity | Anterior-segment examination and OCT quality |
Central subfield thickness is a standardized summary of a small central retinal region. It is most clinically informative when the measured change corresponds to a verified pathological process, particularly central macular edema. Its reproducibility, speed, and accessibility make it valuable for everyday practice and clinical research, but the number incorporates biological tissue, fluid, geometry, and segmentation decisions.
The central interpretive task is to determine what changed and why. Less fluid, less neural tissue, and a different boundary assignment can all reduce CST. Traction, developmental anatomy, and schisis can increase it without ordinary vascular leakage. Progressive disease outside the central circle may leave it unchanged. Treatment success therefore requires disease control and preservation of meaningful function, supported by appropriate morphology and longitudinal evidence.
The most useful habit is to report CST alongside the tissue compartment, layer integrity, visual function, and clinical decision it informs. This retains the efficiency of a numerical biomarker while preserving the anatomical and physiological reasoning required for safe retinal care.
This article is a focused narrative review of foundational OCT research, disease-specific observational studies, randomized trials, and relevant consensus statements. It incorporates literature available through 22 September 2026, including publications released online before their assigned print issue. It is not a systematic review or meta-analysis. Selected trial thresholds and treatment schedules describe the cited study populations and should not be assumed to apply unchanged to every device, patient, jurisdiction, or clinical setting. All figures within this article are original educational schematics, are not to scale, and are not patient OCT images.
This article is educational material. It summarises published evidence and is not a treatment protocol, a substitute for clinical judgement, or a substitute for the instructions for use of any imaging device. Thresholds quoted from clinical trials describe the populations and instruments studied and should not be applied unchanged to other devices, software versions or patient groups.